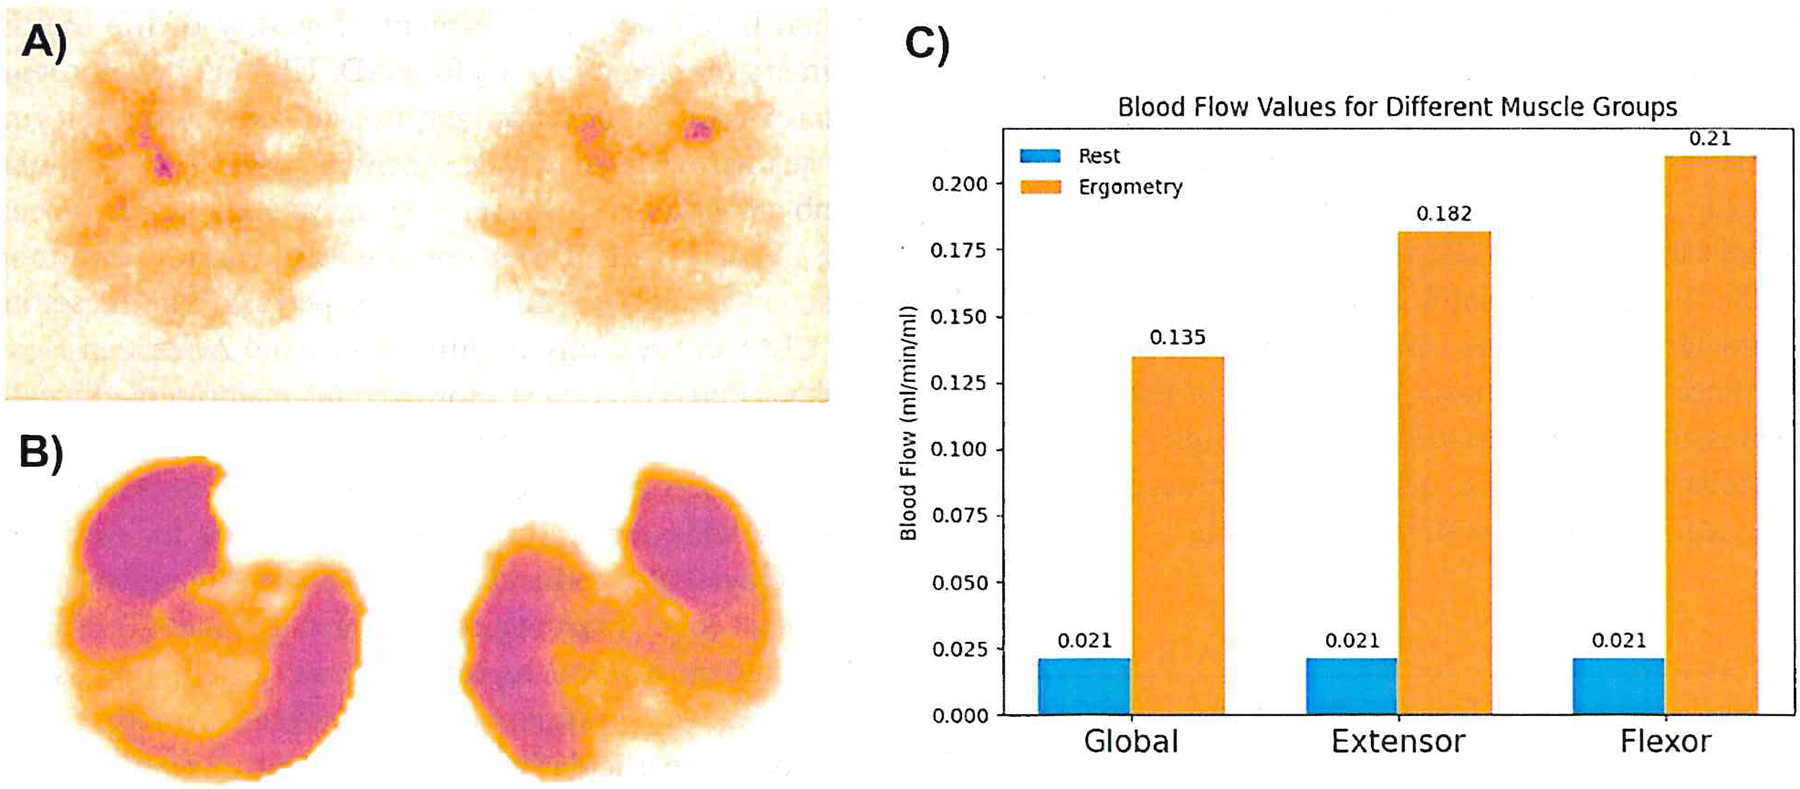
Fig. 1.

Blood flow in a healthy participant. A At rest. B During pedal ergometry, increasing flow in the anterior tibial and medial gastrocnemius muscles. A and B use logarithmic scaling for a wide range of flow values. C Calf muscle blood flow comparison in five volunteers at rest and during pedal ergometry: extensors vs. flexors, with a non-significant p-value at rest and a p-value of 0.022 during ergometry (adapted from [18])
