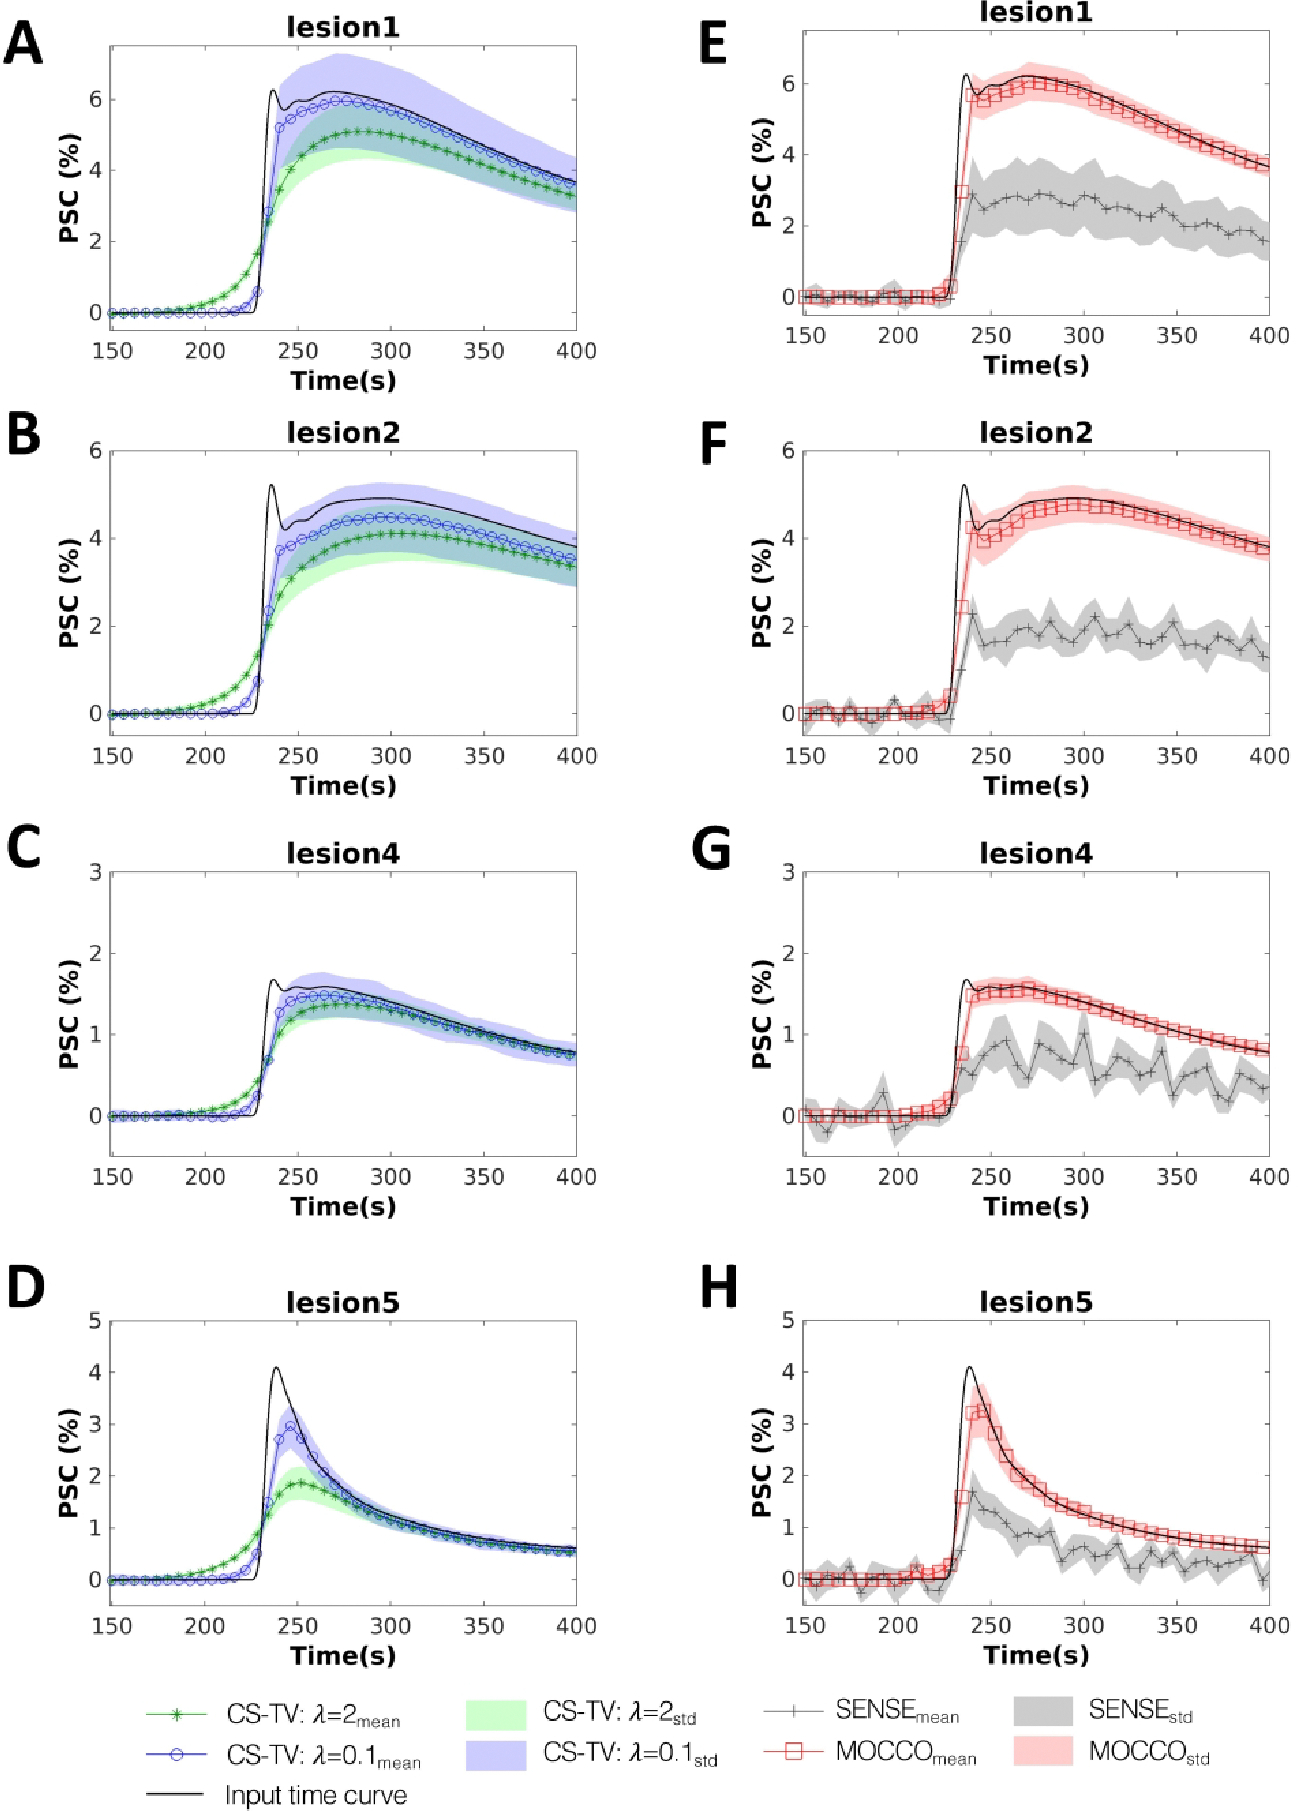
Figure 2.

Simulated contrast agent uptake curves (displayed for a subset of time from 150 to 400 s). Mean percent signal change measured for four 8 mm lesions with varying pharmacokinetics (lesions 1, 2, 4 and 5 as defined in Figure 1) reconstructed using CS-TV with (A-D, blue circles), CS-TV with (A-D, green stars), MOCCO (E-F, red squares) and iterative SENSE (E-F, gray pluses). Standard deviations are shown with banded areas. The input time curves (“true”) used to generate the source data are plotted with dark black lines in all frames.
