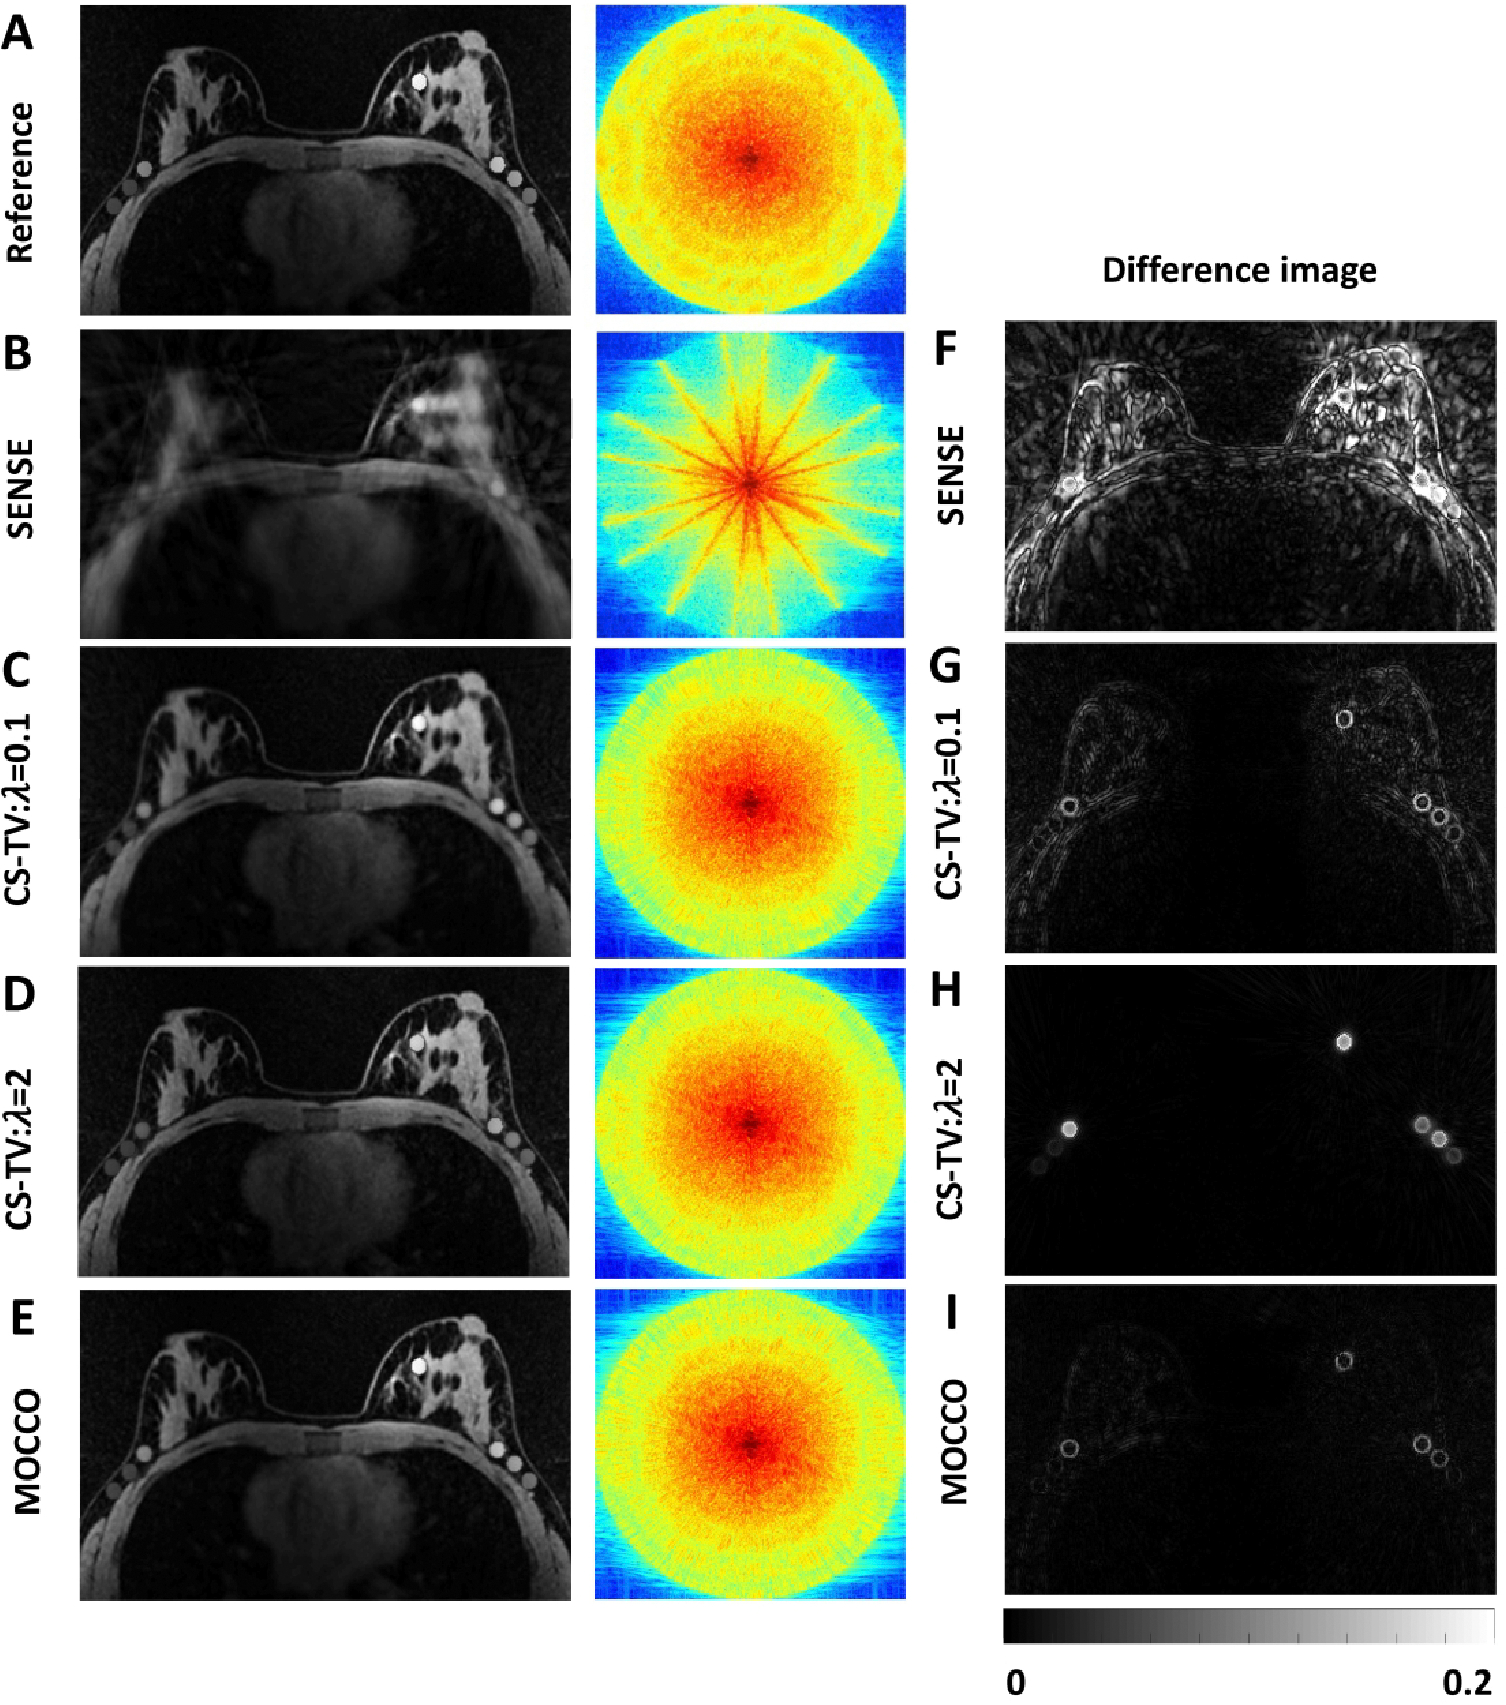
Figure 3.

Reference image (A), reconstructed images (B-E), and corresponding difference images (F-I) all shown for 5 s temporal resolution at time = 240 s. Difference images were measured by subtracting the reconstructed images from the reference image and normalized to the maximum value of the reference image. Log scale k-space plots show how well high and low spatial frequency data were recovered.
