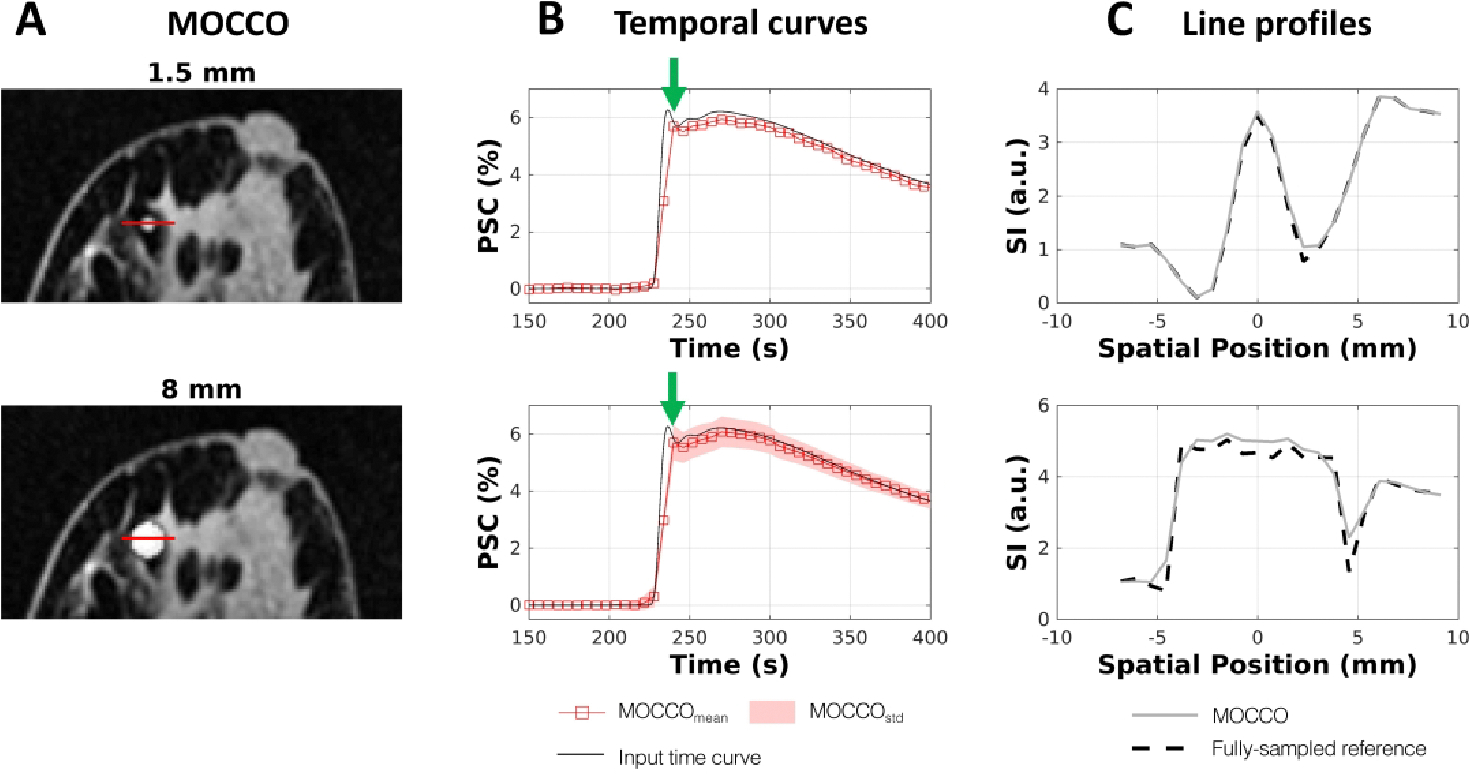
Figure 5.

Performance of spatial and temporal fidelity for lesion 1, which has general curve shape but highest percent signal change (PSC) compared with other lesions. Example images with lesion sizes of 1.5 mm and 8 mm for matched representative time frames (A). Corresponding percent signal time curves compared to the input time curves (B). The line profiles (C) through the center of the lesion (red line in (A)) plotted for MOCCO-reconstructed (solid line) and fully-sampled reference images (dashed line) corresponding to T = 240 s (green arrows in B).
