
Figure 6.
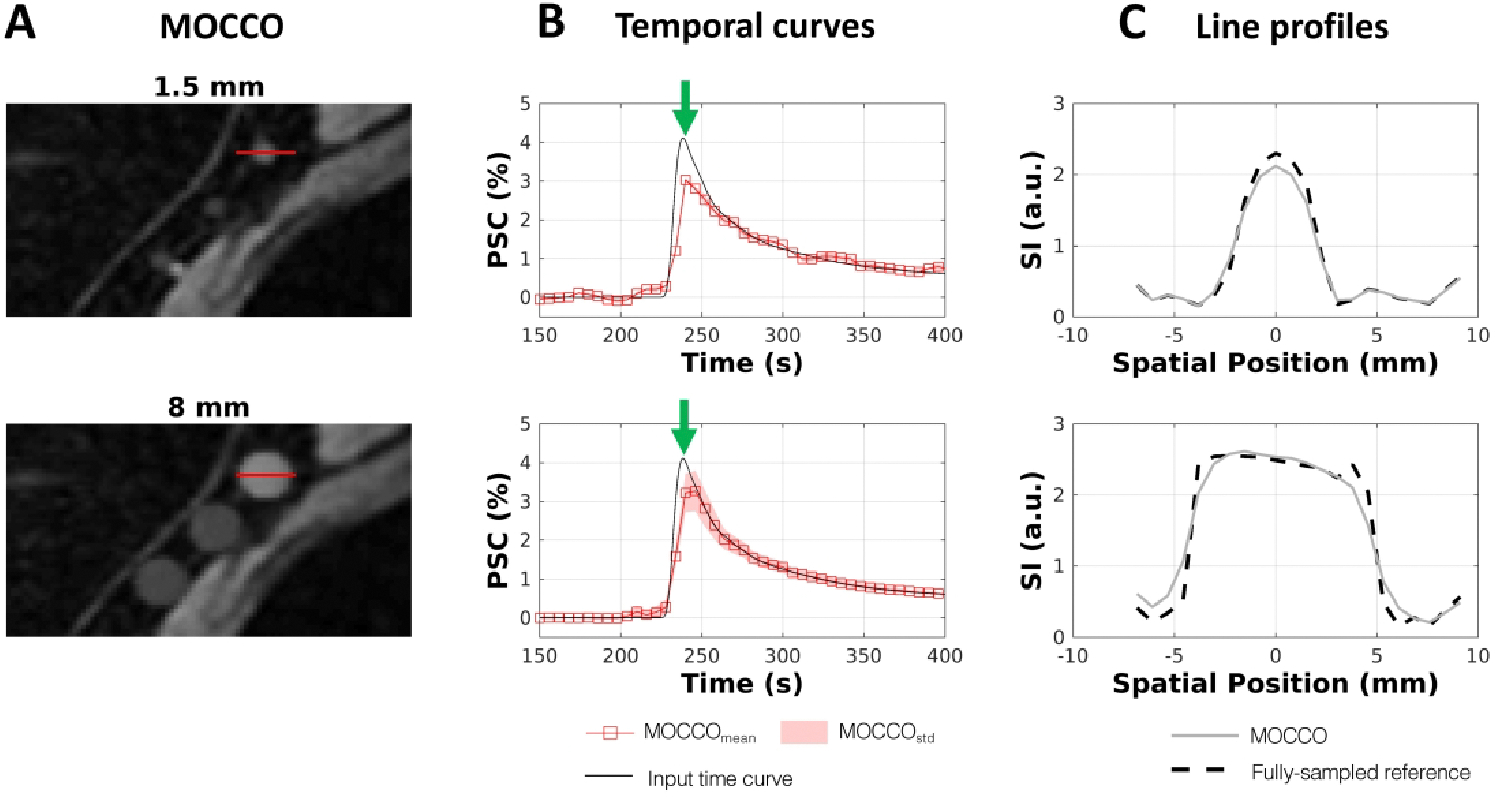
Evaluation of spatial and temporal fidelity for a lesion with sharper wash-in and wash-out contrast kinetics. Zoomed-in region at the right side of the axilla with lesions 5 – 7 is shown for MOCCO (A) at T = 240 s. Percent signal time curves evaluated for lesion 5 show modest temporal blurring at small lesion sizes (1.5 mm) (B). Line profiles shown in (C) were measured horizontally through lesion 5 as indicated by red lines in (A). The dash line profile is from the fully-sampled reference images. The solid gray profile is from the MOCCO image. Note underestimation of the signal intensity at the center of the lesion although the edges are well preserved.