
Figure 7.
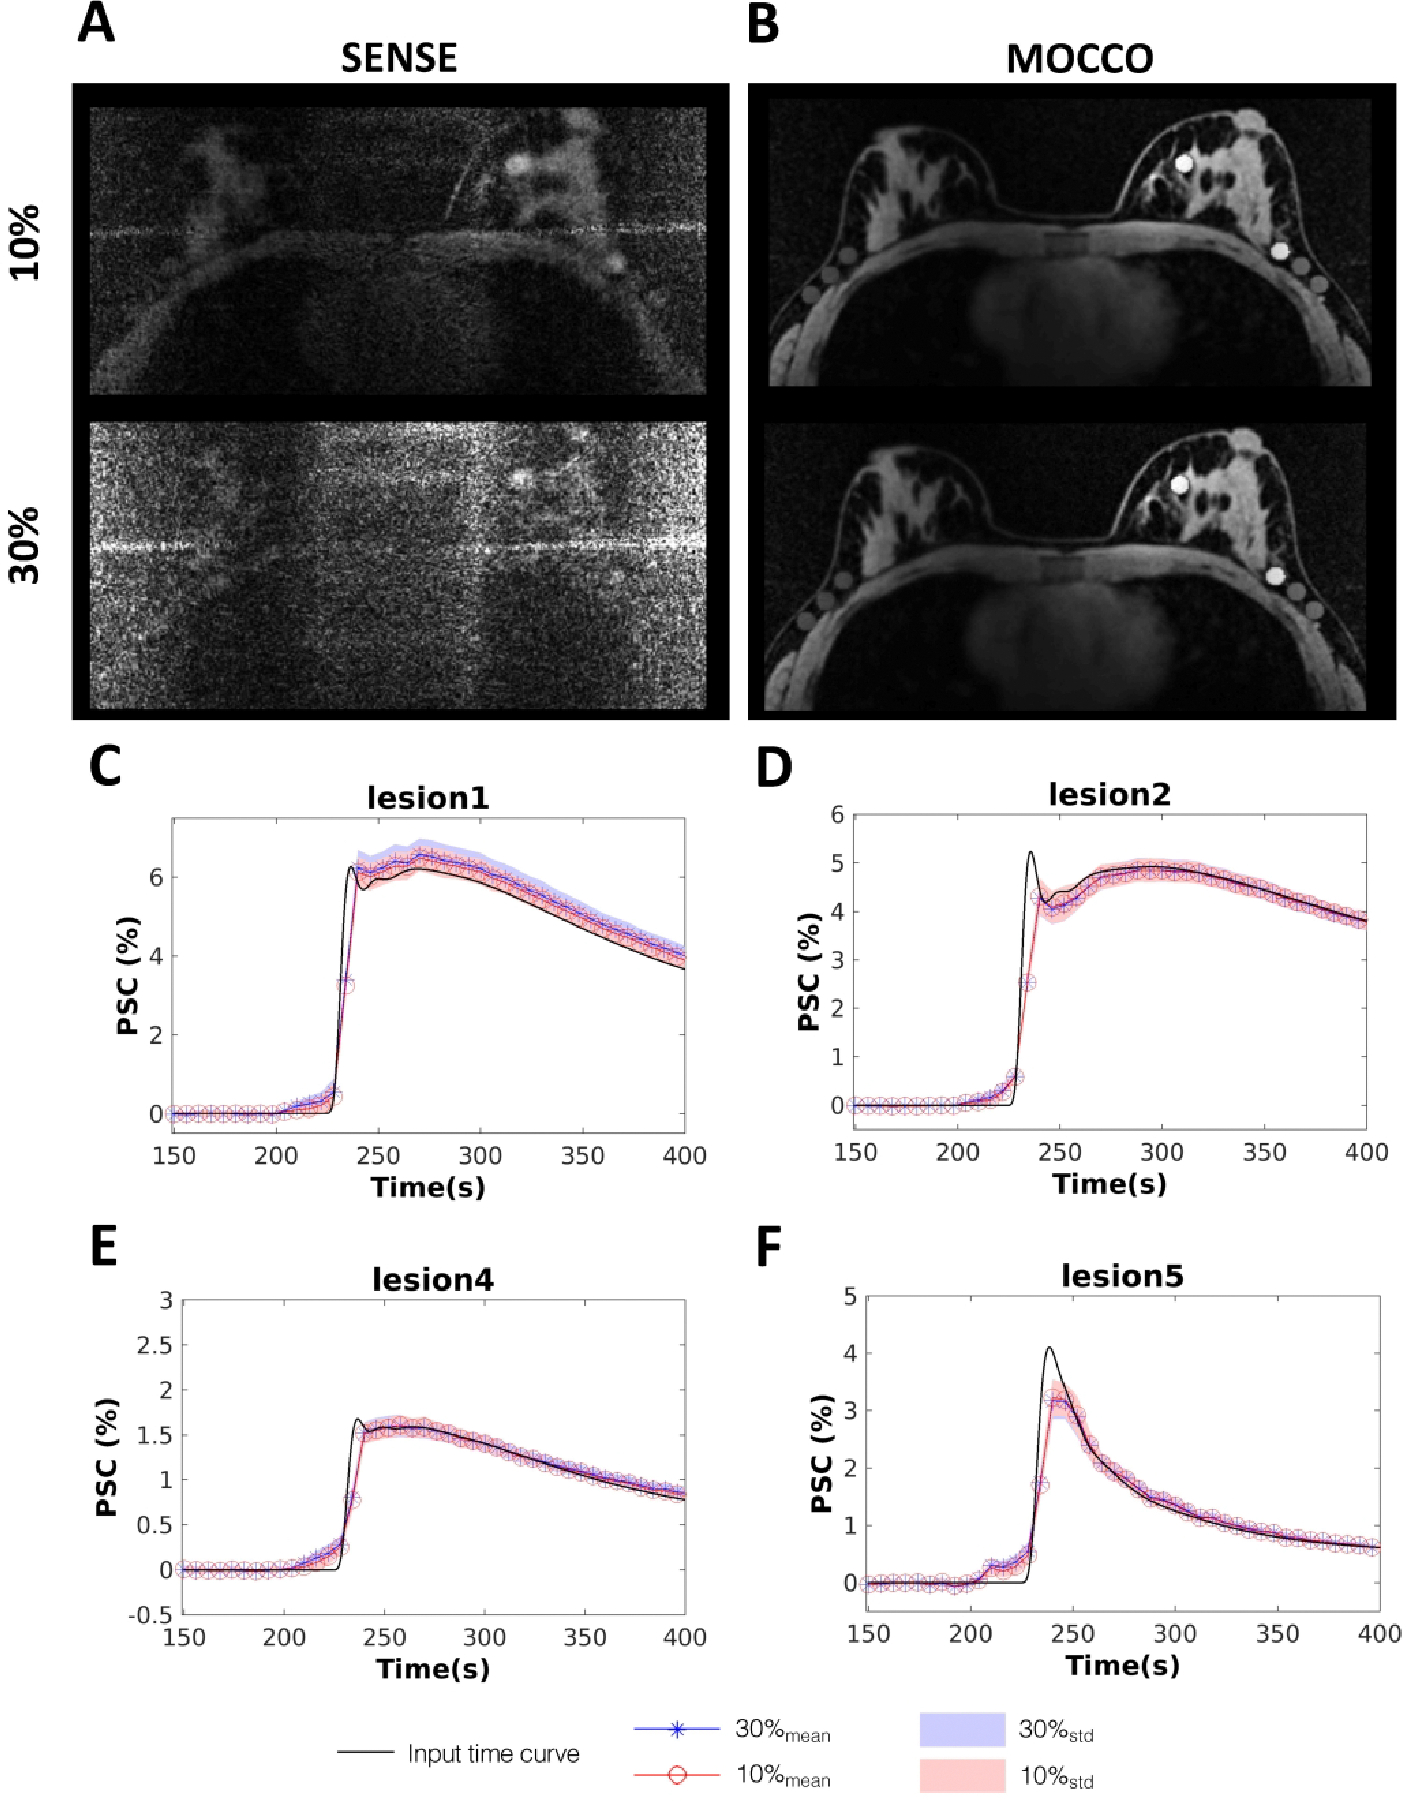
SENSE (A) and MOCCO (B) images with additive Gaussian noise equal to 10% and 30% of the mean k-space magnitude at time = 300 s. The corresponding mean percent signal change time curves of lesion 1, 2, 4 and 5 for MOCCO (C-F) with 10% (red circles) and 30% (blue stars) additive noise. Standard deviations are represented by the banded areas. The input time curve is plotted with dark black lines.