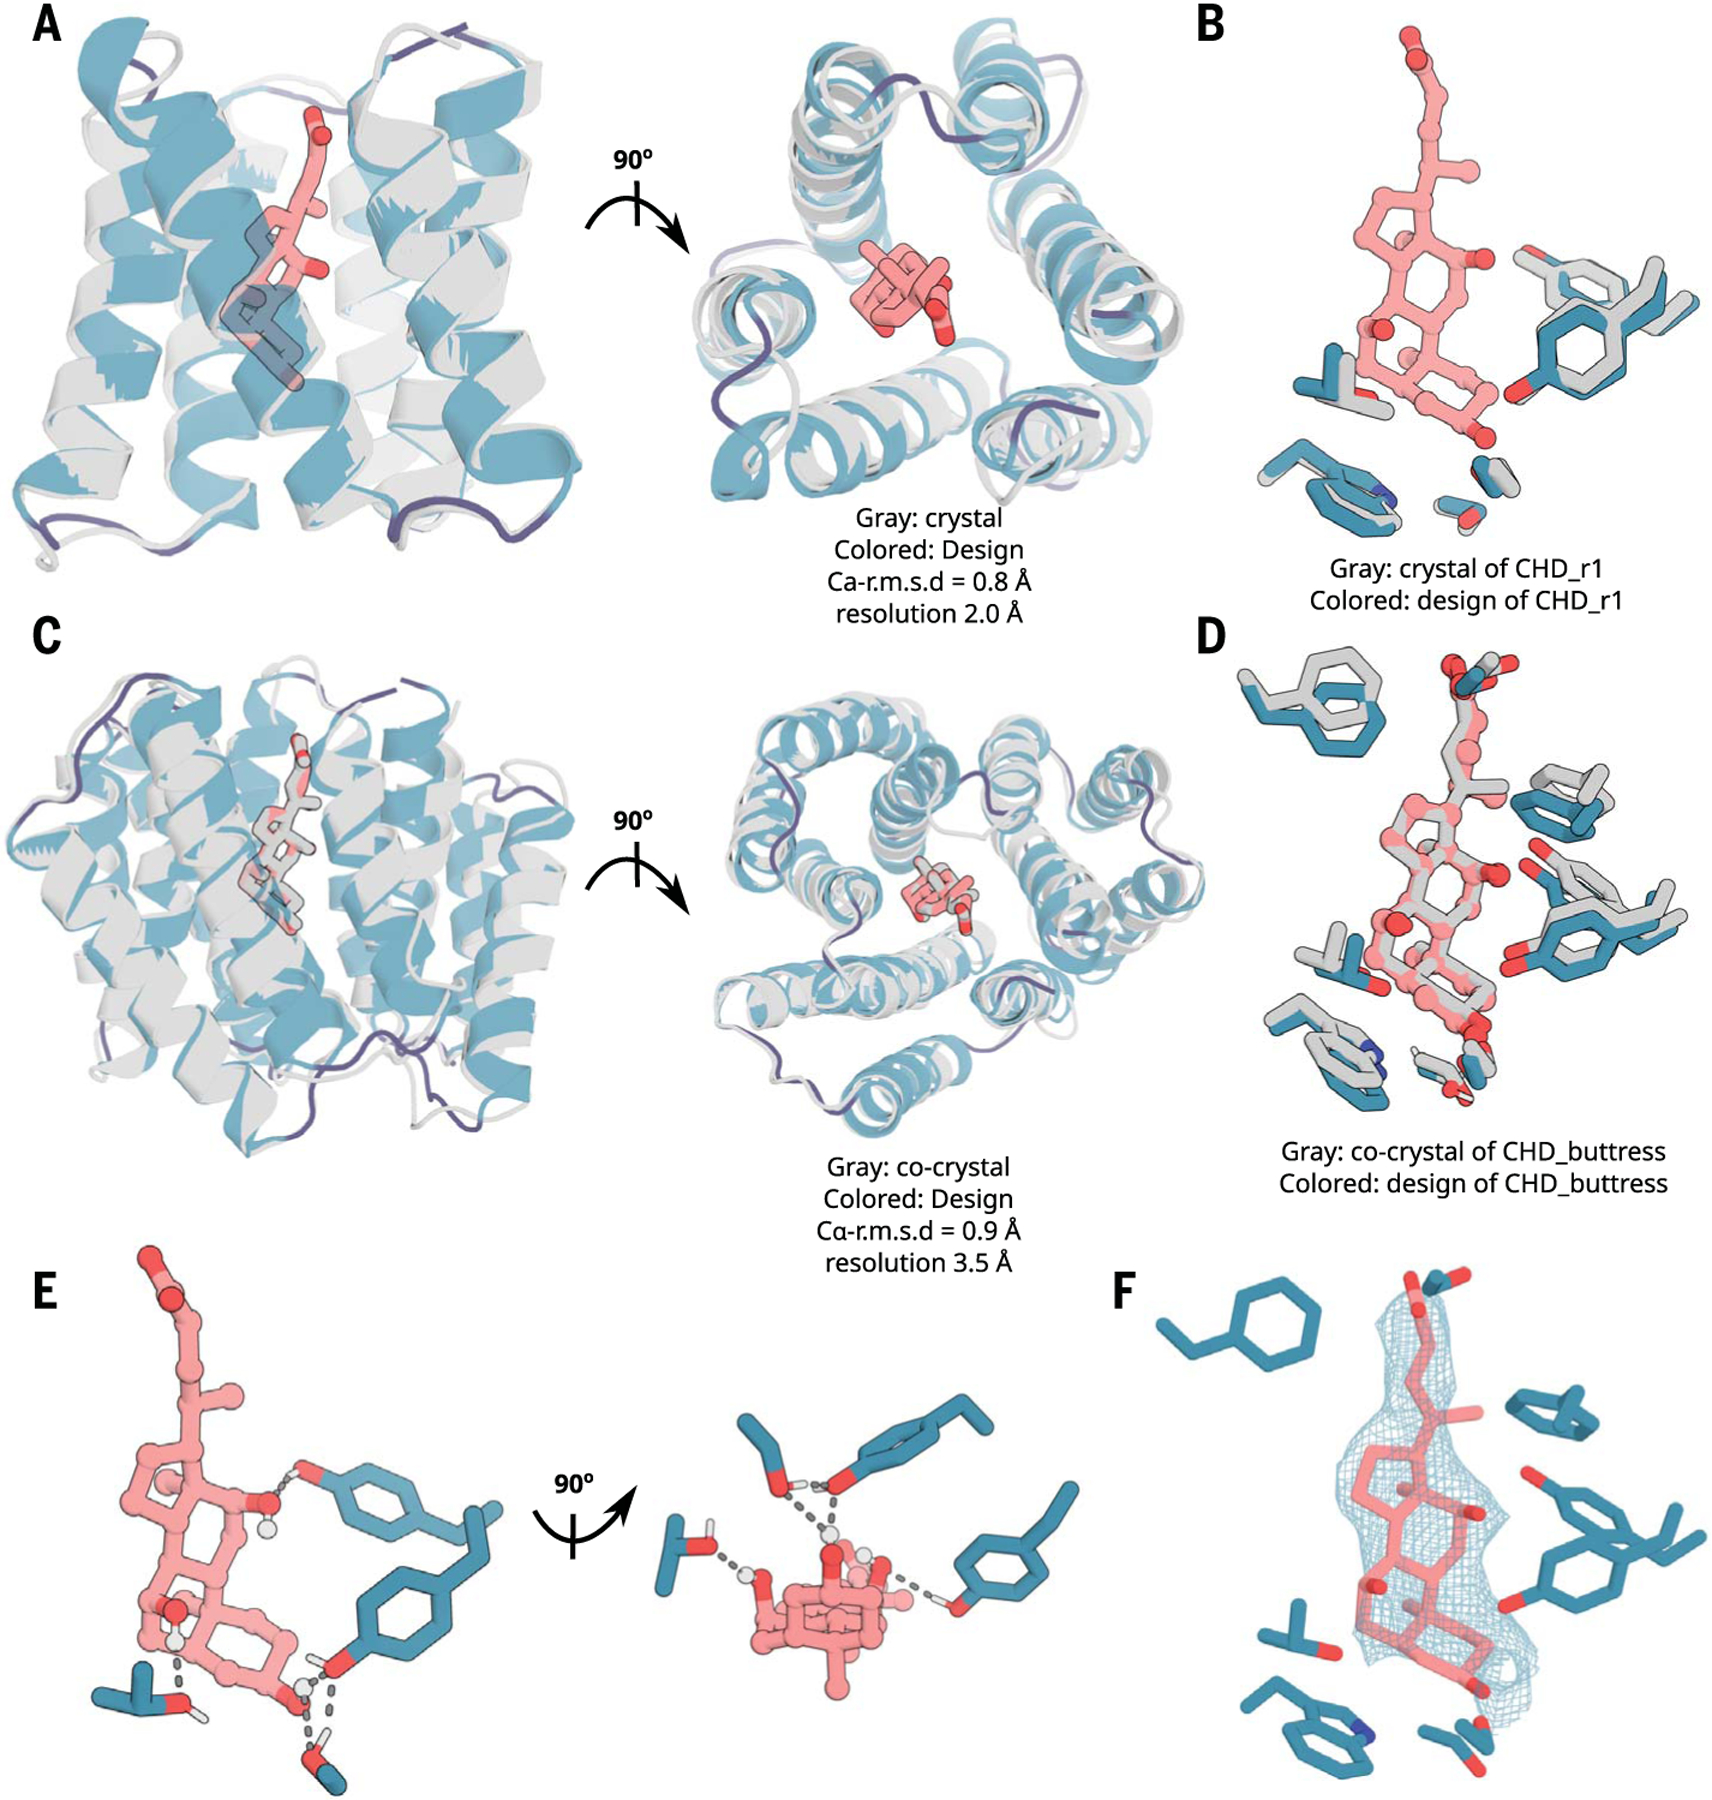
Fig. 2. X-ray crystallography demonstrates accuracy of design approach.

(A and B) The crystal structure of CHD_r1 (gray; ligand not modeled because of partial ligand electron density) is very similar to the computational design model (colored). (C and D) The crystal structure and the binding interface of CHD_buttress (gray) is very similar to the computational design model (colored). (E) The key polar- and hydrogen-bonding networks at the designed interface. (F) Composite omit map of interface region; the 2mFo-DFc electron density map at 1 σ level for CHD_buttress matches the design closely. Density maps are colored in teal. The protein backbone is shown in cartoons, and CHD and the key interacting side chains are shown in sticks. Pink, ligand carbon atoms; red, oxygen; blue, nitrogen; white, polar hydrogen. Also see fig. S7.
