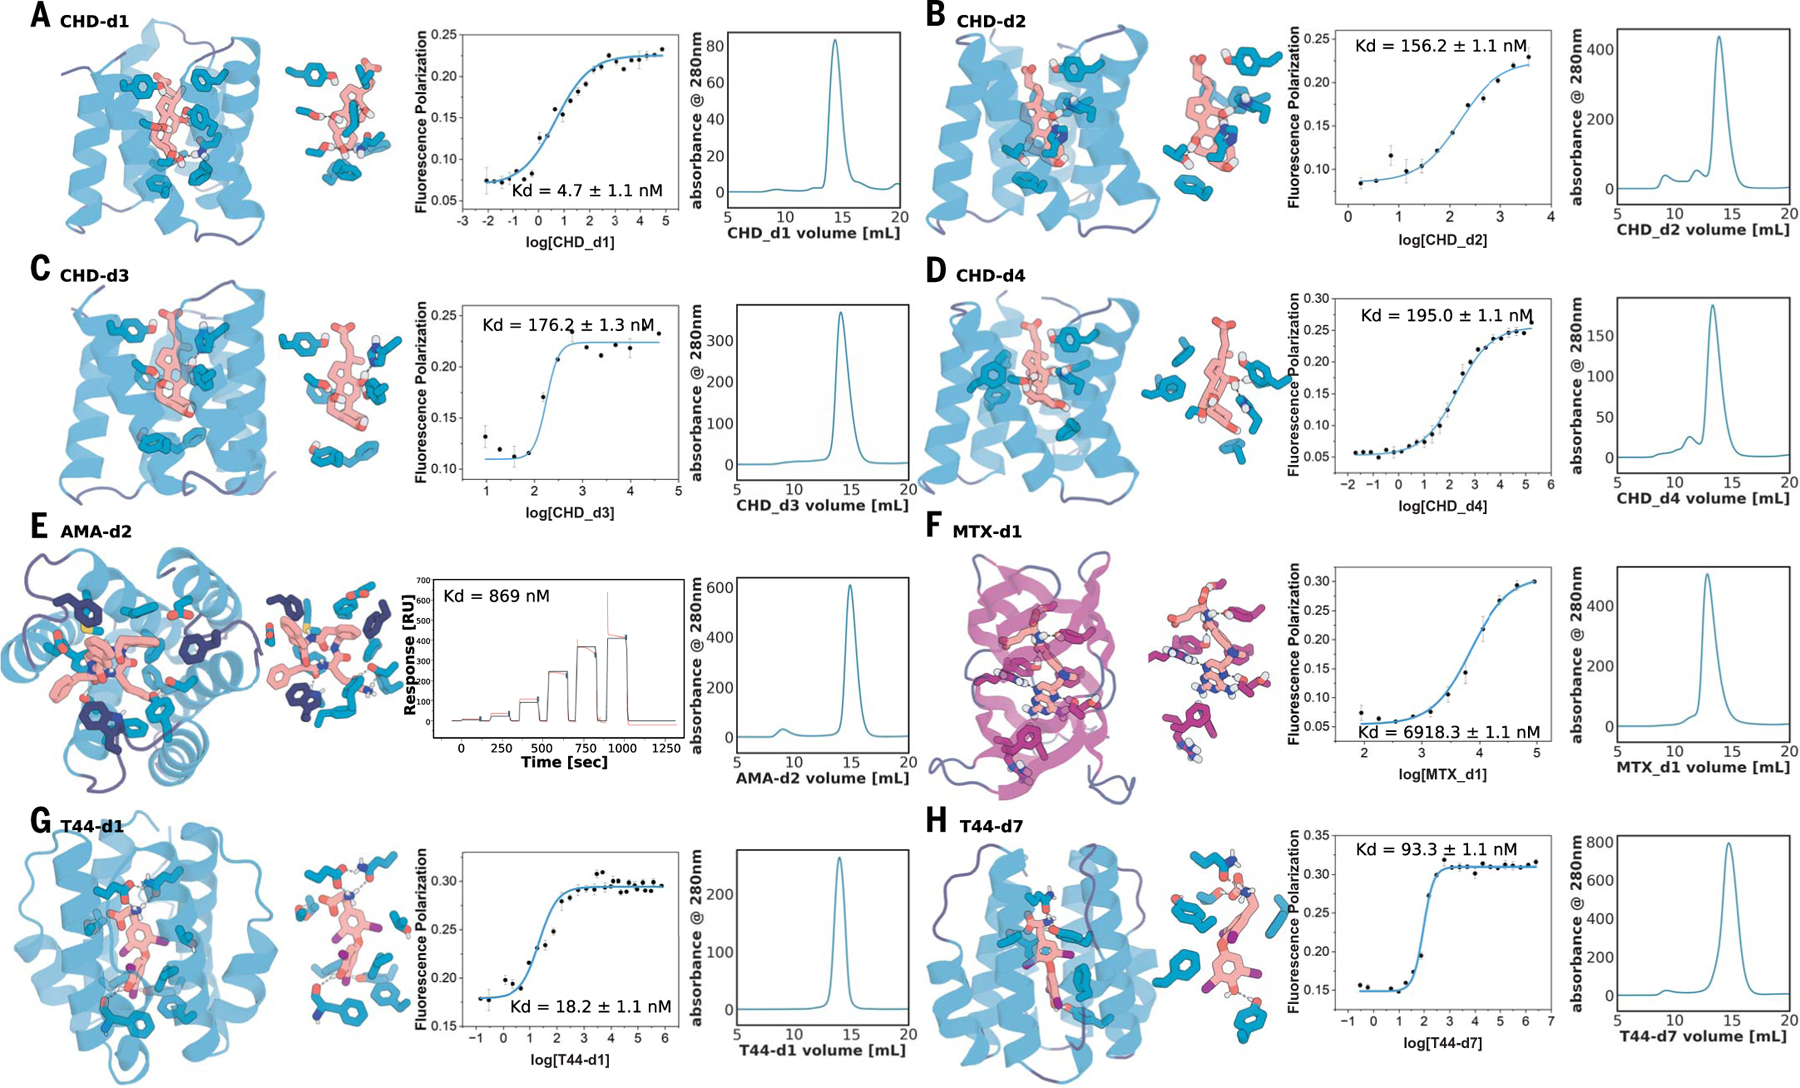
Fig. 3. Experimental characterization of selected round-two designs.

(A to D) Nanomolar affinity CHD binders CHD_d1 to d4 (full list in fig. S9). (E) Nanomolar binder for AMA (see fig. S12). (F) Micromolar methotrexate binder. (G and H) Two nanomolar T44 binders (full list in fig. S14). For each panel, from left to right: the design model, zoom-in on the side-chain–ligand interactions, FP (or SPR in the case of AMA) binding measurements, and SEC traces. Kd values and error bars are from two independent experiments. Interacting side chains and ligands are shown in sticks, with oxygen, nitrogen, iodine, and polar hydrogen colored in red, blue, purple, and white, respectively. Key interactions are indicated by gray dashed lines. Cartoons and sticks for helixes, sheets, and loops are colored in teal, magenta, and dark blue, respectively.
