
Figure 1.
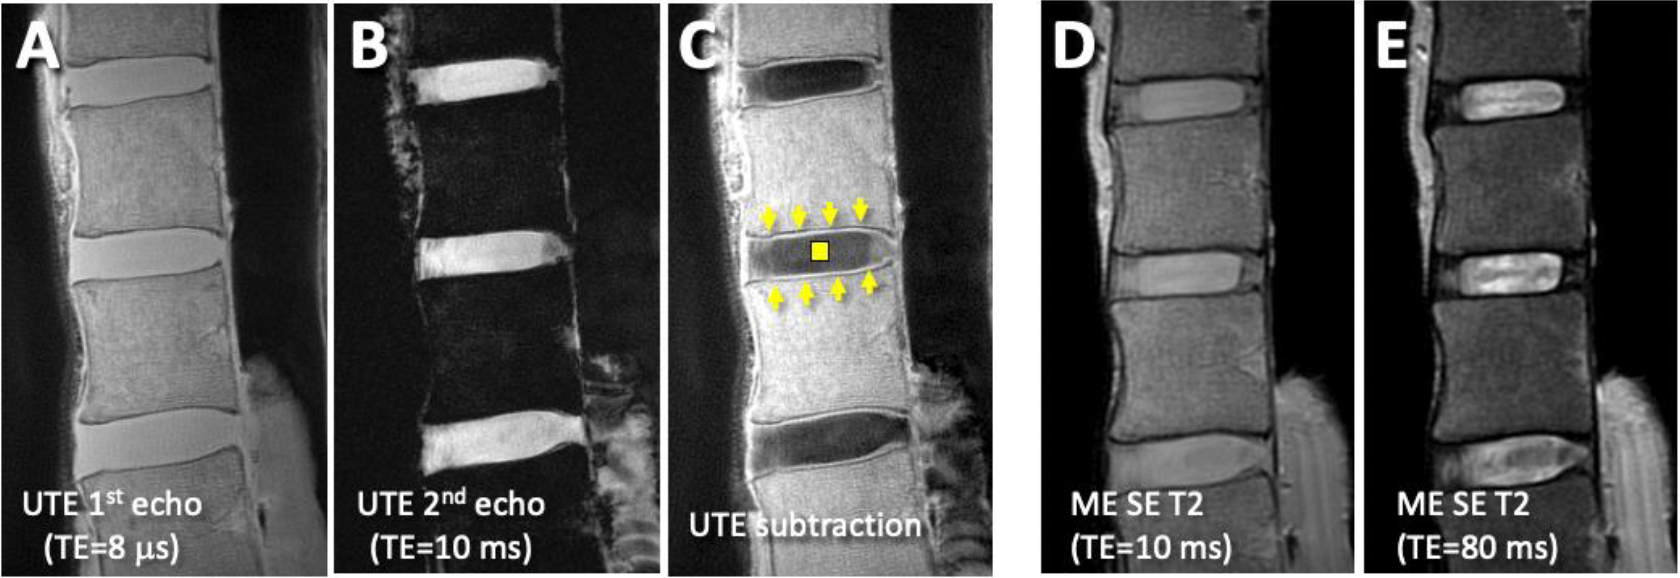
Sagittal MR images of a cadaveric lumbar spine with relatively normal cartilage endplate (CEP) and discs. (A) Ultrashort echo time (UTE) 1st echo and (B) 2nd echo images were digitally-subtracted to obtain (C) UTE subtraction image. The subtraction image (C) shows normal CEP (arrows) as continuous, linear and high signal intensity adjacent to hypointense vertebral endplates and nucleus pulposus (square). In the corresponding (D) Proton density-weighted (obtained with multi-echo spin echo T2, ME SE T2, at echo time, TE, of 10 ms) and (E) T2-weighted (obtained with ME SE T2 sequence at TE of 80 ms) MR images, the region of CEP is difficult to distinguish from adjacent tissues.