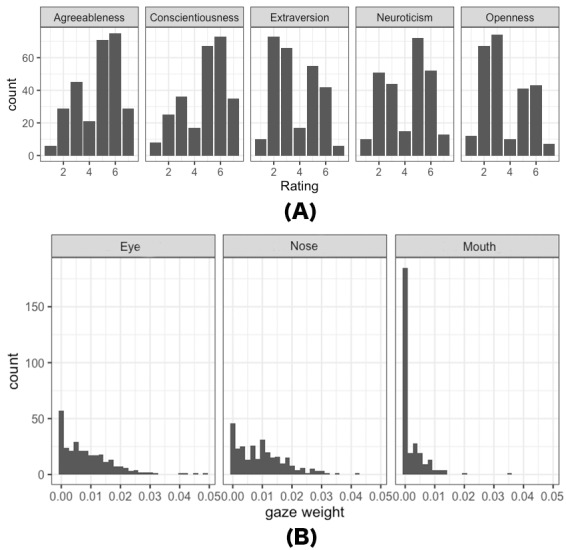
Figure 2.

(A) Distribution of participants’ rating scores for the five impressions in Experiment 1, and (B) distribution of eye movements of all participants (N=34) in Experiment 1 when rating extraversion for all stimuli (N=50). Refer to the Data Preprocessing section for the method of calculating gaze weight. The higher the gaze weight, the more attention is paid to the corresponding area.
