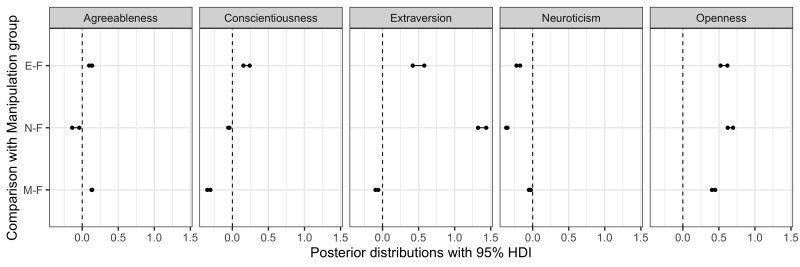
Figure 9.
95% HDI of posterior distributions of pair-wise comparison between Free (control) condition and experimental conditions in ratings.
Note. E-F indicates differences between Eye and Free conditions (M-F and N-F indicates differences in Mouth and Free and Nose and Free conditions, respectively). The further to the right from the dashed line, the higher the ratings under the experimental conditions, and the further to the left from the dashed line, the higher the evaluation results under Free observation condition.

