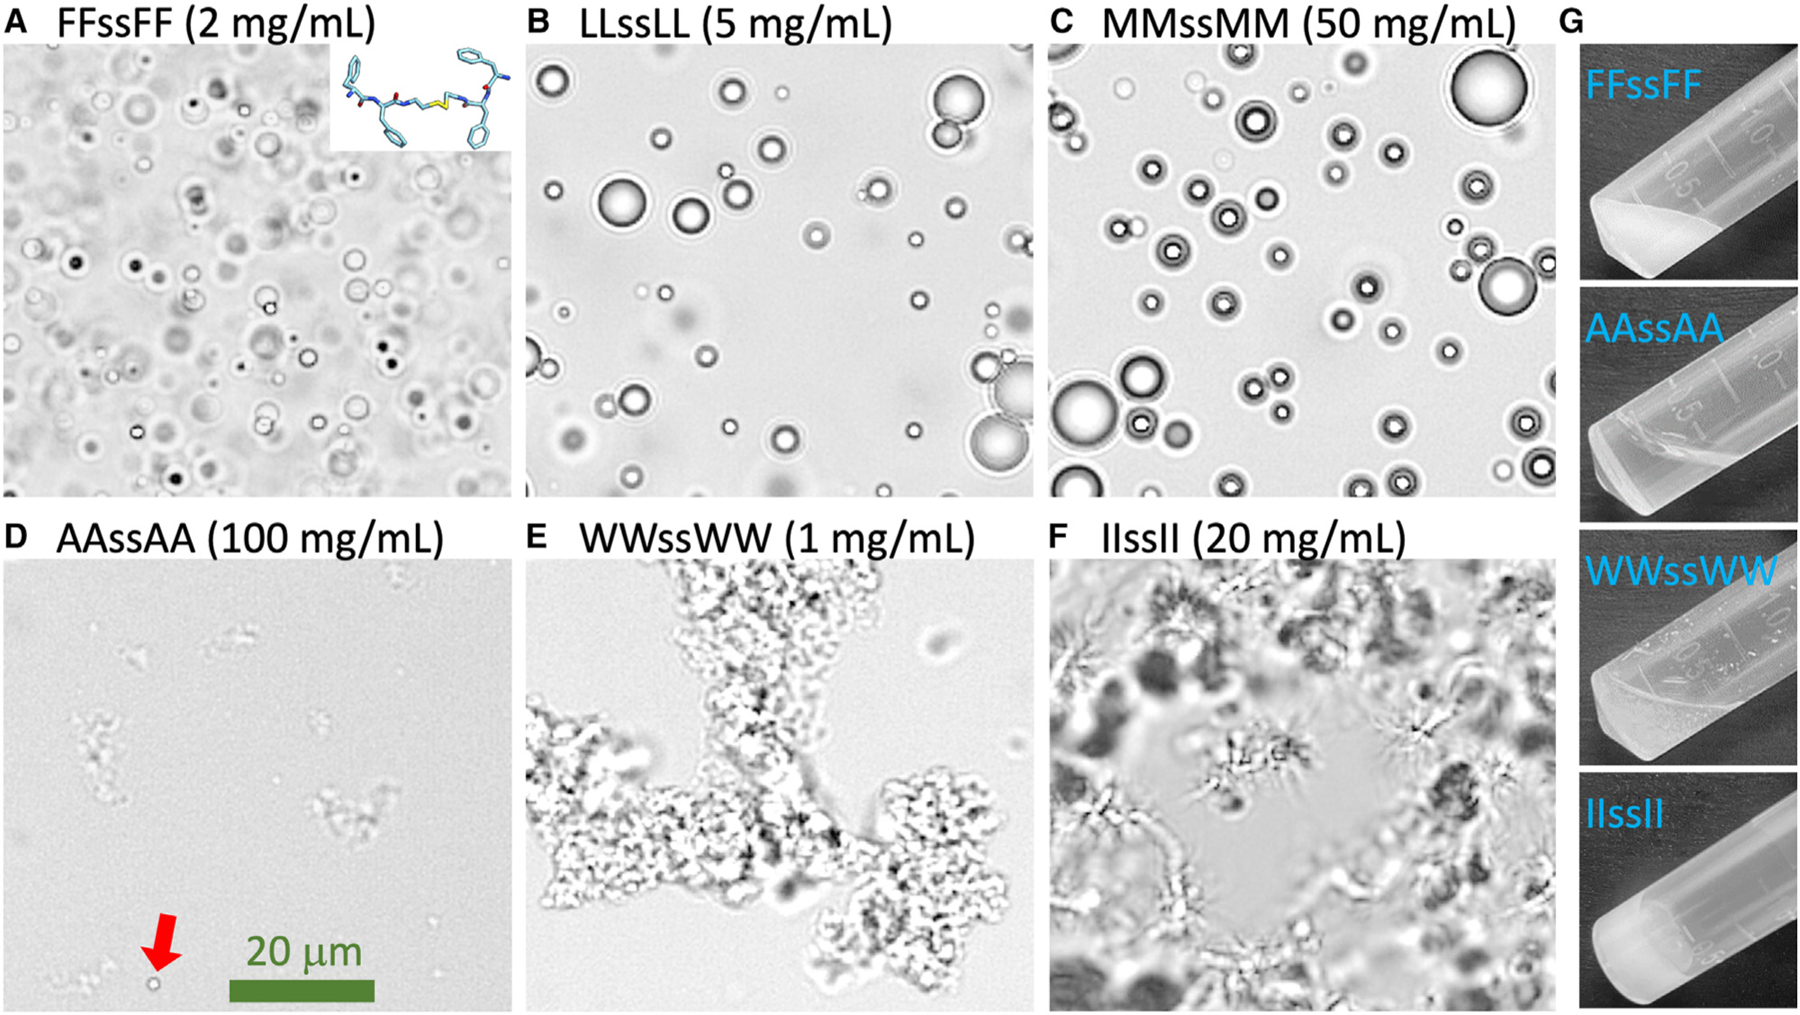
Figure 1. Images showing various forms of tetrapeptide condensates.

(A–F) Bright-field images of six tetrapeptide condensates formed at the indicated concentrations in Milli-Q water and at pH 13. In (D), a droplet is indicated by a red arrow.
(G) Images of 300-μL samples in a tube, all taken within 2 min of raising the pH from 2 to 13. The scale bar shown represents 20 μm.
