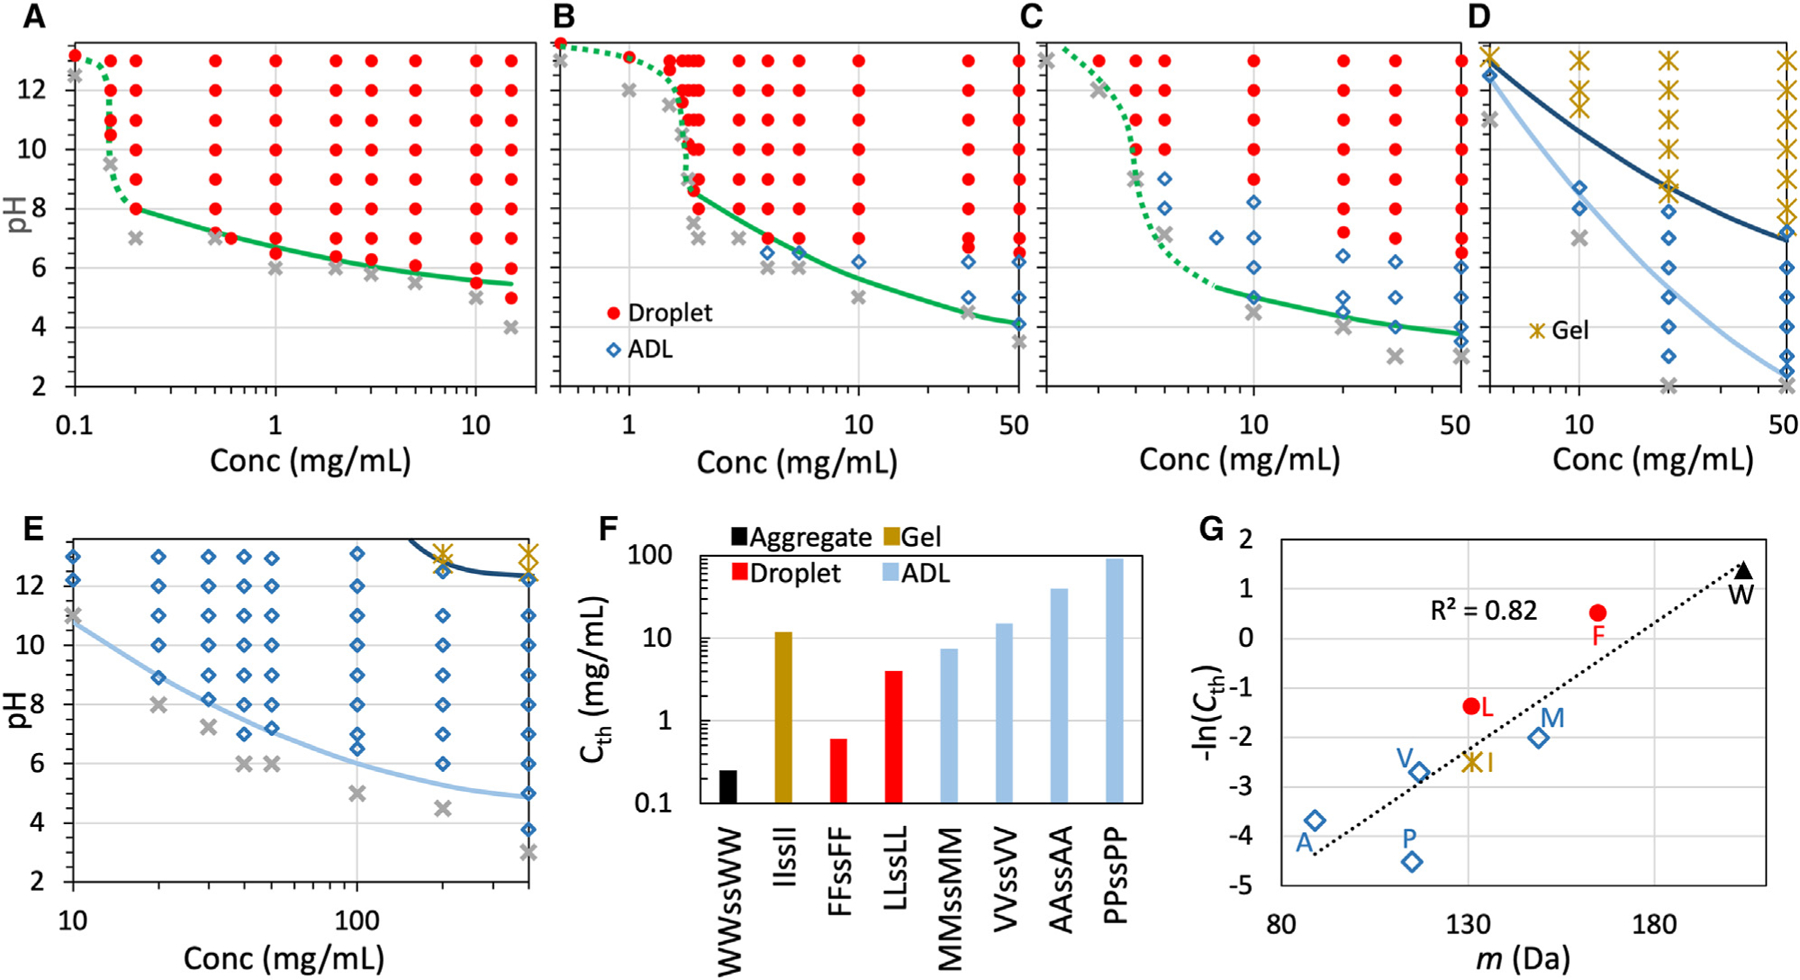
Figure 3. Phase diagrams and threshold concentrations at pH 7.

(A–E) Phase diagrams of tetrapeptides with X = F, L, M, V, and A in 50 mM imidazole buffer. Solid curves are fits to a parabolic function (Equation 1); dotted curves are drawn to guide the eye. For LLssLL and MMssMM, the transition from ADL to droplets may span a finite interval of pH, which expands with increasing peptide concentration to ~1 pH unit; in the transition region, the morphology is assigned to the dominant species.
(F) Threshold concentrations for phase separation at pH 7.
(G) Correlation between threshold concentration and amino acid molecular mass.
