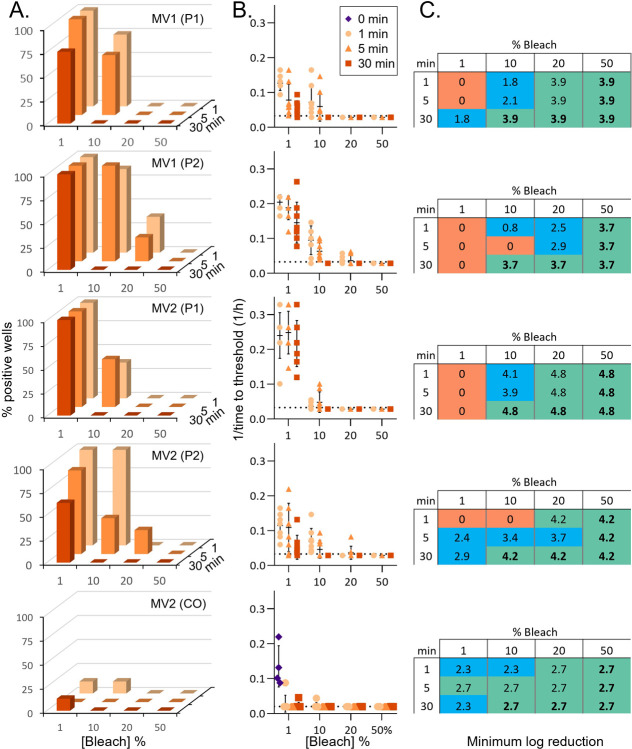
Fig 2. Inactivation of prion seeding activity in tissues from passaged sCJD material.
A. Percent positive reaction wells following increasing treatment times with increasing concentrations of bleach. P1 indicates brain tissue from a mouse inoculated with human sCJD brain material. P2 indicates brain tissue from a mouse inoculated with P1 material. CO indicates a human cerebral organoid inoculated with human sCJD brain homogenate. B. Inverse time to threshold kinetics for each individual reaction following increasing treatment times and concentrations. The 0 min condition refers to testing of the same dilution of untreated brain homogenate. This is only displayed for MV2 (CO) as the equivalent dilutions were not tested on the reaction plates with the P1 and P2 treatments. C. Estimated log reductions in seeding activity displayed as minimum log reduction (see methods). Orange, blue, and green highlighting indicate no detectable loss, partial loss, or complete loss of seeding activity, respectively. Bold numbers indicate treatment conditions that resulted in total loss of seeding activity across all passaged sCJD subtypes. Row 1, MV1(P1); Row 2, MV1(P2); Row 3, MV2(P1); Row 4, MV2(P1); Row 5, MV2(CO).

