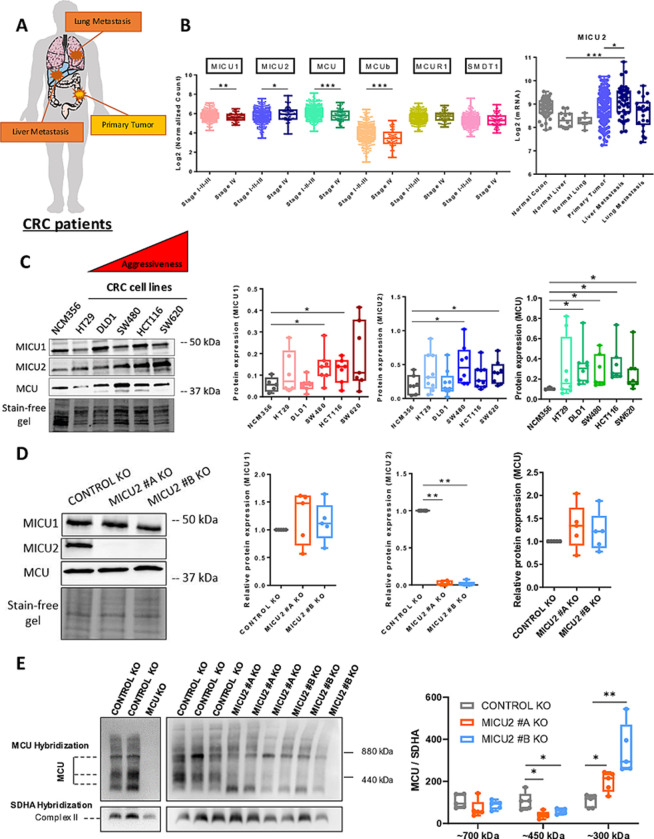
Fig 1. Expression of MICU2 in stage IV CRC and in metastases from patients with CRC.
(A) Representative scheme of organs used for the bioinformatics analysis of normal, primary tumor, and metastatic samples. (B) Transcriptomic analysis of MICU2 in the GSE41258 (top panel) data sets and of the expression of the players in the MCU complex in the TCGA (bottom panel). Each data point represents an individual sample (ANOVA followed by Dunn’s multiple comparisons test). (C) Left panel: representative western blot of MCU, MICU1, and MICU2 in a panel of CRC cell lines with variable aggressiveness. Right panel: quantification of the protein expression of MCU, MICU1, MICU2 western blot (n = 5–9, Mann–Whitney test). (D) Representative western blot of MCU, MICU1, and MICU2 expression in the HCT116 Control and MICU2 KO cell lines obtained by CRISPER-Cas9 methodology. Quantification of the protein expression of MICU1, MICU2, and MCU in the HCT116 Control KO, MICU2 #A KO, and MICU2 #B KO cell lines (n = 6, Kruskal–Wallis test). On all plots, *p < 0.05, **p < 0.01, and ***p < 0.001. (E) Left panel: representative western blot of the MCU complex, in HCT116 control, MCU KO and MICU2 KO cell lines. Right panel: quantification of MCU multiprotein complex size by western blot (n = 5, Mann–Whitney test). The data underlying the graphs shown in the figure can be found in S1 and S2 Datas. CRC, colorectal cancer; KO, knockout; MCU, mitochondrial calcium uniporter.

