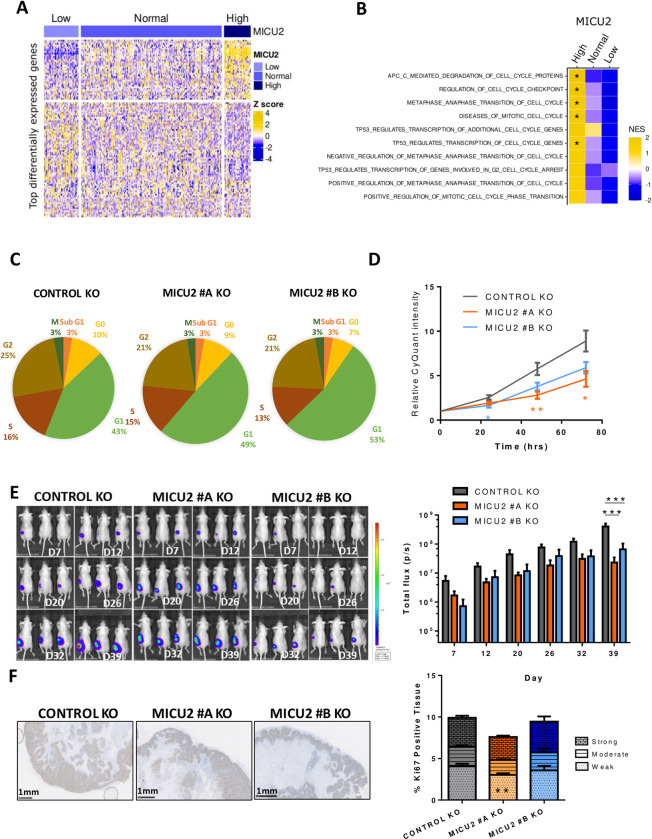
Fig 2. Involvement of MICU2 in the CRC tumor phenotype.
(A) Heatmap of the most differentially expressed genes between colon tumor samples in the TCGA-COAD dataset with low, normal, or high expression of MICU2. (B) Heatmap of normalized enrichment scores of the top 10 cell cycle-associated gene signatures obtained by GSEA for primary colon tumor samples with low, normal, or high expression of MICU2. (C) Graphical representation of the cell cycle in the Control and MICU2 KO cells lines (n = 6, ANOVA followed by Dunnett’s multiple comparisons test). (D) CyQuant proliferation analysis of the Control and MICU2 KO cells lines (n = 11, Kruskal–Wallis test). (E) Representative bioluminescence images of cancer progression in mice injected with the luciferase-expressing Control or MICU2 KO cells lines and quantification of whole-body bioluminescence (n = 10, ANOVA followed by Dunnett’s multiple comparisons test). (F) Representative images of tumoral tissue sections stained for Ki67 from xenografted Control and MICU2 KO cells lines and quantification of the percentage of tissue positive for Ki67. The intensity of positivity was scored as weak, moderate, or strong. The scale bar is 1 mm (n = 6, ANOVA followed by Sidak’s multiple comparisons test). On all plots, *p < 0.05, **p < 0.01, and ***p < 0.001. The data underlying the graphs shown in the figure can be found in S1, S2 and S3 Datas. CRC, colorectal cancer; GSEA, gene set enrichment analysis; KO, knockout.

