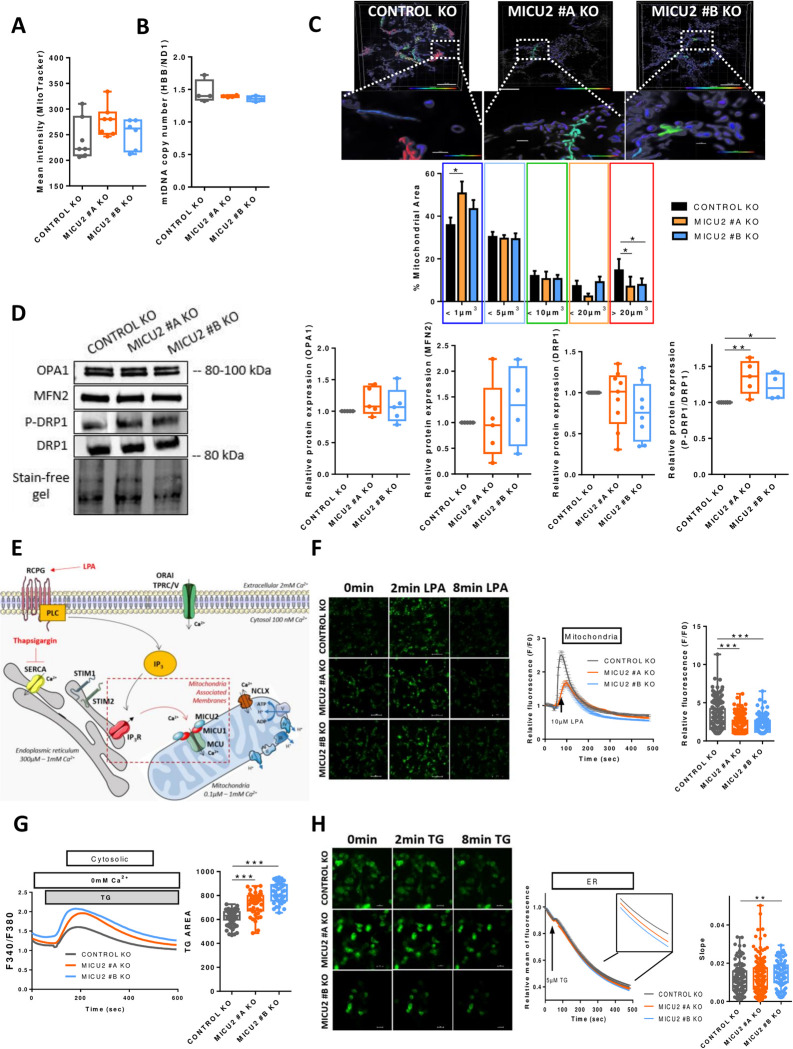
Fig 3. The role of MICU2 in the mitochondrial network and Ca2+ signaling.
(A) Quantification of the number of mitochondria in the Control and MICU2 KO cell lines with Mitotracker green. (B) Quantification of mitochondrial DNA copy number by RT-qPCR using primers HBB and ND1. (C) Top panel: representative 3D images of the mitochondrial network of the HCT116 Control and MICU2 KO cell lines colored based on the mitochondrial volume. The enlargement shows an example of mitochondria with different shapes. The scale bar is 10 μm. Bottom panel: bar graphs representing the distribution of the mitochondrial population based on the mitochondrial volume. The data are presented as the mean ± standard deviation. ANOVA followed by Dunnett’s multiple comparisons test with 10 to 15 cells. (D) Left panel: representative western blot of mitochondrial fusion (OPA1 and MFN2) and fission (DRP1 and P-DRP1) proteins in the Control and MICU2 KO cell lines. Right panel: relative protein expression of mitochondrial fusion and fission proteins (n = 4–5, ANOVA followed by Dunn’s multiple comparisons test). (E) Schematic illustration of LPA-induced or TG-induced cytosolic Ca2+ and mitoCa2+ signaling in non-excitable cells. (F) Left panel: representative images of the Control and MICU2 KO cell lines transfected with the genetically encoded mitoCa2+ indicator mt-riG6m and stimulated with LPA. The scale bar is 100 μm. Right panel: relative Ca2+ responses induced by LPA in Control and MICU2 KO cell lines expressing the mitoCa2+ probe mt-riG6m (the data are presented as the mean ± SEM of 8 independent experiments regrouping 354–594 cells, Kruskal–Wallis test). (G) Left panel: representative SOCE traces in the Control and MICU2 KO cell lines. Right panel: boxplot representing the ER-Ca2+ store depletion by TG in the absence of extracellular Ca2+ (n = 6, N = 42–95, ANOVA followed by Dunnett’s multiple comparisons test). (H) Left panel: representative images of the Control and MICU2 KO cell lines transfected with the genetically encoded ER Ca2+ indicator miGer and stimulated with TG. The scale bar is 20 μm. Right panel: relative ER Ca2+ content. The boxplot represents the slope of TG-induced ER Ca2+ release (n = 6–8, N = 88–156, Mann–Whitney test). On all plots, *p < 0.05, **p < 0.01, and ***p < 0.001.The data underlying the graphs shown in the figure can be found in S1 Data. ER, endoplasmic reticulum; KO, knockout; LPA, lysophosphatidic acid.

