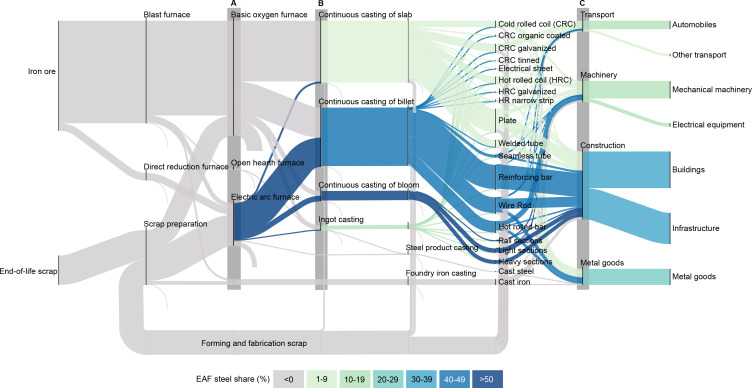
Figure 3.
Global steel flows from raw materials to end-use products in 2020. The thickness of each flow reflects the weight of steel; the colour reflects the proportion of steel produced from EAF. The iron ore flow represents the iron embedded in the ore and excludes the mass of oxygen and gangue. The method is based on [43] with the same assumption for EAF steel processed into slabs with [44]. The diagram was designed with floWeaver software with all flows scaled to Mt yr−1 [45]. Three key flows are marked on this diagram: (A) Approximately 70% of steel is currently produced by the BF-BOF process and the remaining 30% by EAFs using either scrap or DRI as the primary feedstock. (B) Almost all EAF steel is currently processed into billets and blooms, with a limited capacity for slabs. (C) There is a marked difference between the share of EAF steel in finished steel products used in construction and in other industries.

