. 2024 Nov 7;13:RP93766. doi: 10.7554/eLife.93766

Figure 1. PKA-C but not PKA-R redistributes to spines upon activation.

(A, B) Representative two-photon images of PKA-C-mEGFP co-expressed with PKA-RIIα or PKA-RIβ at rest, or in the presence of norepinephrine (NE) or forskolin and IBMX (F+I). mCherry (magenta) was co-expressed to reveal the neuronal morphology. (C–E) Quantification and comparison of the spine enrichment index at the resting state (C) and upon activation (D, E). As in panel C from left to right, n (spines/neurons)=53/11, 34/7, 33/6, and 36/7. Error bars represent s.e.m.

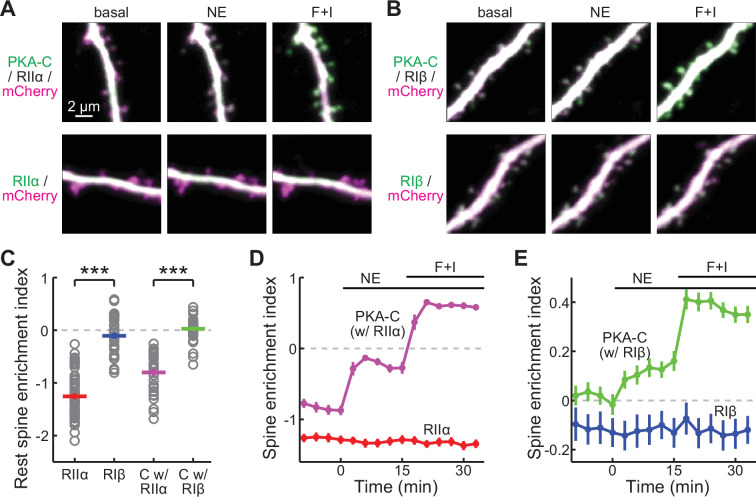
Figure 1—source data 1. Numeric data for Figure 1.

Figure 1.

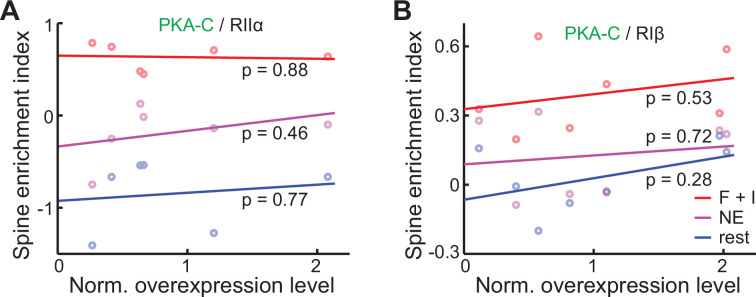
Figure 1—figure supplement 1. Spine enrichment indexes and the movement of PKA-C into spines upon activation are not dependent on the protein expression level.

Figure 1—figure supplement 1.

(A–B) Averaged spine enrichment indexes within individual neurons of PKA-C co-expressed with RIIα (A) and RIβ (B), and their linear fit at rest or under the indicated stimulation.
Figure 1—figure supplement 1—source data 1. Numeric data for Figure 1—figure supplement 1.

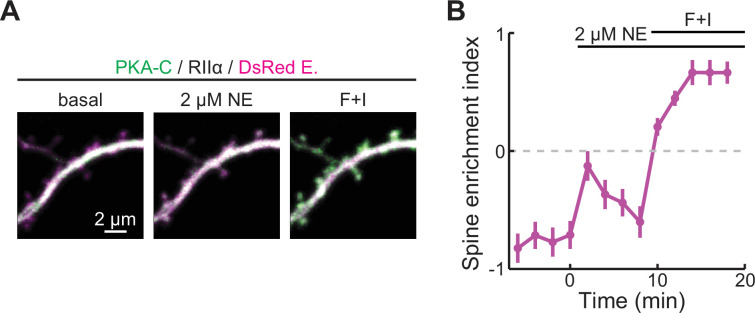
Figure 1—figure supplement 2. PKA-C translocation can be driven by norepinephrine at low concentrations.

Figure 1—figure supplement 2.

(A, B) Representative two-photon images (A) and the collective trace of PKA-C-mEGFP co-expressed with PKA-RIIα at rest, or in the presence of 2 μM norepinephrine (NE) or forskolin and IBMX (F+I). DsRed Express (magenta) was co-expressed to reveal the neuronal morphology. n (spines/neurons)=16/4. Error bars represent s.e.m.
Figure 1—figure supplement 2—source data 1. Numeric data for Figure 1—figure supplement 2.

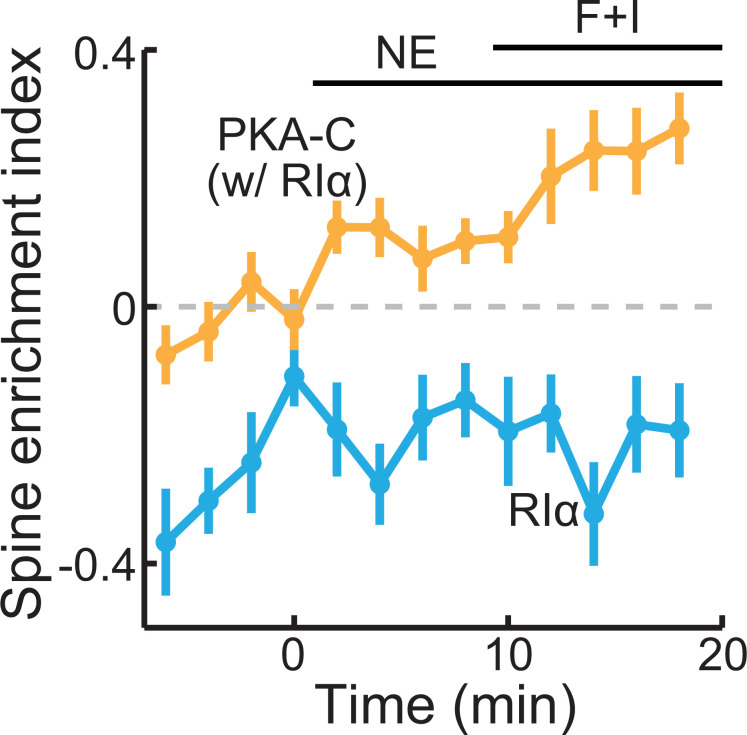
Figure 1—figure supplement 3. PKA-C and PKA-RIα differentially re-distributed upon activation.

Figure 1—figure supplement 3.

The collective trace of PKA-C-mEGFP co-expressed with PKA-RIα (orange) and PKA-RIα-mEGFP (light blue) at rest, or in the presence of 10 μM norepinephrine (NE) or forskolin and IBMX (F+I). DsRed Express was co-expressed to reveal the neuronal morphology. n (spines/neurons)=20/5 for PKA-C and 16/4 for RIα. Error bars represent s.e.m.
Figure 1—figure supplement 3—source data 1. Numeric data for Figure 1—figure supplement 3.