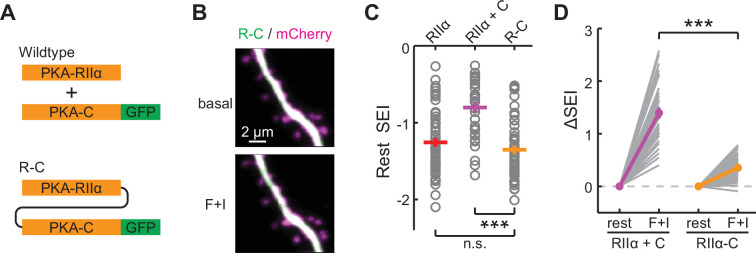
Figure 2. Characterization of the inseparable R-C.
(A) Schematic of wildtype PKA versus R-C. In both cases PKA-C was C-terminally tagged by mEGFP. (B–C) Representative images (B), quantifications of resting distribution (C), and the distribution change upon stimulation by forskolin and IBMX (D) of R-C compared to PKA-RIIα-mEGFP and co-expressed PKA-C-mEGFP/PKA-RIIα. RIIα and RIIα+C data are from Figure 1C. n (spines/neurons)=48/10. Error bars represent s.e.m.

