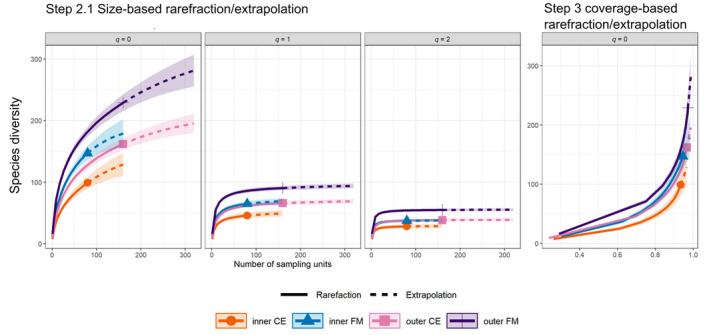
FIGURE 5.

Asymptotic and non‐asymptotic diversity profiles. Species diversity for q = (0, 1, 2) plotted against the number of sampling units (asymptotic) and species diversity for q = 0 plotted against the sampling completeness (non‐asymptotic) for the assemblages of the inner and outer CE and the inner and outer FM.
