
FIGURE 6.
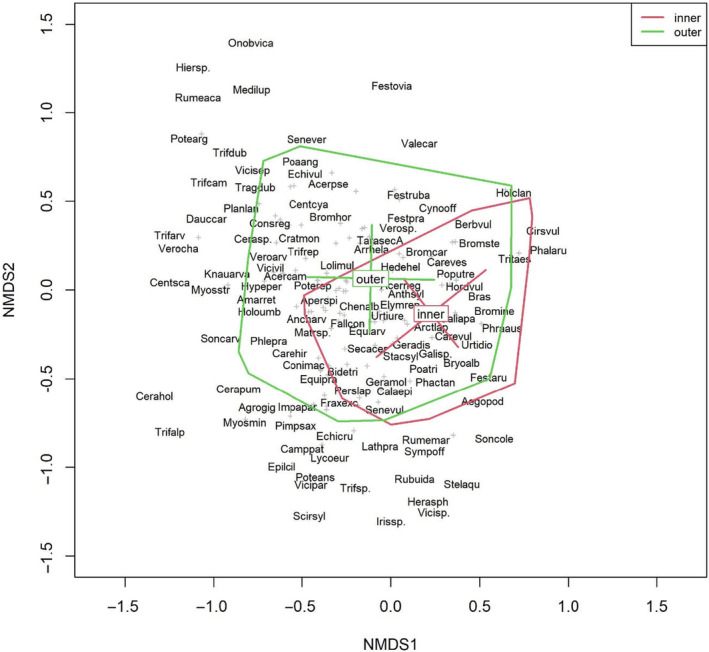
NMDS plot showing the species community of the FM and the centroids of the “inner” and “outer” FM groups. Names of the more dominant species are shown, and the remaining species are displayed as “+” symbols. Axes 1 and 2 are shown. Species names are abbreviated as follows: First four characters of the genus name, followed by the first three characters of the species name and the first character of the subspecies name, if needed. The hulls and centroids with bars were calculated based on standard deviations.