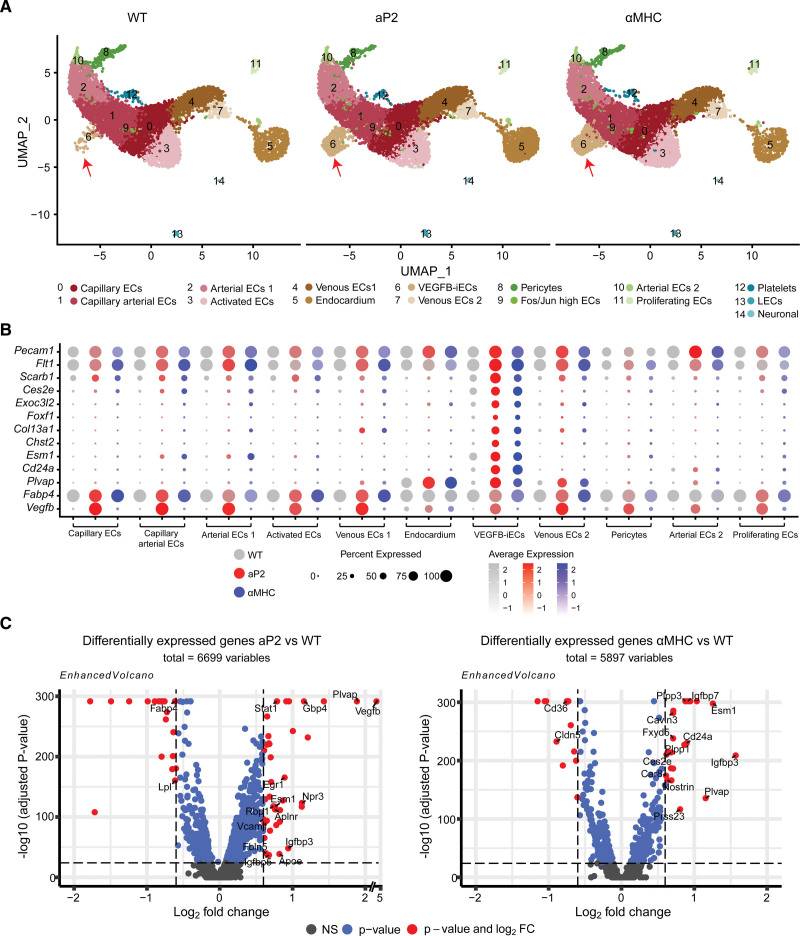
Figure 2.
Single-cell RNA sequencing of isolated cardiac endothelial cells (ECs) from VEGF-B (vascular endothelial growth factor B) transgenic (TG) mice reveals the expansion of a unique EC population. A, Uniform manifold approximation and projection (UMAP) plot showing clusters obtained from Seurat-integrated analysis of cardiac ECs isolated from aP2 (adipocyte protein 2)-VEGF-B, myosin heavy chain alpha (αMHC)-VEGF-B, and wild-type (WT) adult mice. B, Dot plot showing the average expression and the expression percentage of vascular endothelial growth factor B–induced endothelial cells (VEGFB-iECs) and EC markers in selected clusters of aP2-VEGF-B, αMHC-VEGF-B, and WT mice. The dot plot was generated using the DotPlot() function embedded in the Seurat package. The average expression was plotted using log-normalized and scaled data stored in the Seurat object under the slot scale.data. C, Volcano plots showing the highest differentially expressed genes (DEGs) across all cardiac ECs from aP2-VEGF-B vs WT mice or αMHC-VEGF-B vs WT mice. Volcano plots present the values obtained from Seurat-integrated DEG analysis where avg log2FC is presented on the x axis and log10-adjusted P value is presented on the y axis. The P value is adjusted based on Bonferroni correction using all features in the data set. The single-cell data sets were generated through the pooling of 3 hearts into 1 sample per group.

