Figure 4.
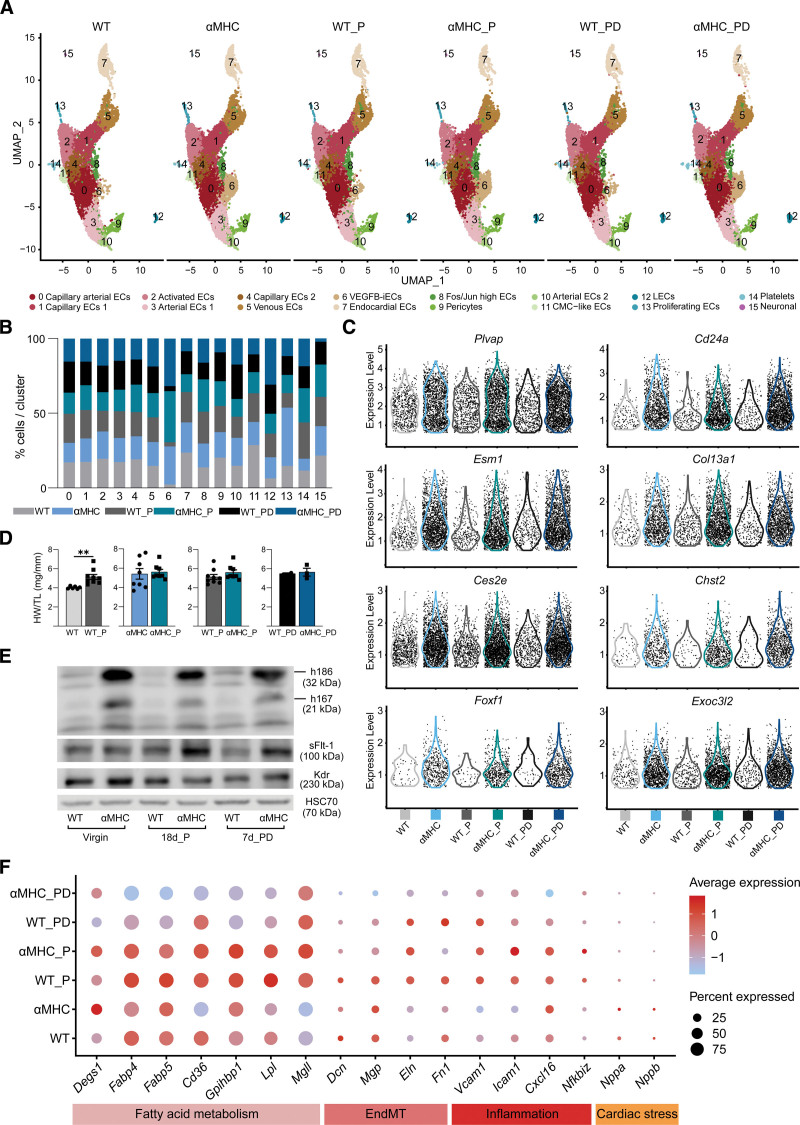
Cardiac hypertrophy in pregnant mice does not increase vascular endothelial growth factor B–induced endothelial cells (VEGFB-iECs). A, Uniform manifold approximation and projection (UMAP) plot showing clusters obtained from Seurat-integrated analysis of isolated cardiac endothelial cells (ECs) from pregnant wild-type (WT) and myosin heavy chain alpha (αMHC)-VEGF-B littermate mice at 18 days of pregnancy (_P) and 7 days postdelivery (_PD) in comparison to nonpregnant WT and αMHC-VEGF-B mice. B, Bar plot showing the comparison of the percentage of each cell population across all 6 groups. C, Violin plots showing expression of VEGFB-iEC cluster markers in all 6 groups. D, Heart weight (HW)/tibial length (TL) comparison in 18-day pregnant vs nonpregnant mice and at 7 days postdelivery from WT and αMHC-VEGF-B transgenic (TG) mice (n=6 WT, 9 WT_P, 8 αMHC, 8 αMHC_P, 2 WT_PD, and 3 αMHC_PD). *n≥6 unpaired 2-tailed t test with Welch correction; n≤6 unpaired Mann-Whitney t test. E, Western blot (WB) analysis of hVEGF-B, mVEGFR-1, and mVEGFR-2 in heart lysates from all 6 groups. F, Dot plot showing the average expression and the expression percentages of markers of fatty acid metabolism, endothelial-to-mesenchymal transition (EndMT), inflammation, and cardiac stress across all groups. The dot plot was generated using the DotPlot() function embedded in the Seurat package. The average expression is plotted using log-normalized and scaled data stored in the Seurat object under the slot scale.data. The single-cell data sets were generated through pooling of 2-3 hearts into 1 sample per group.

