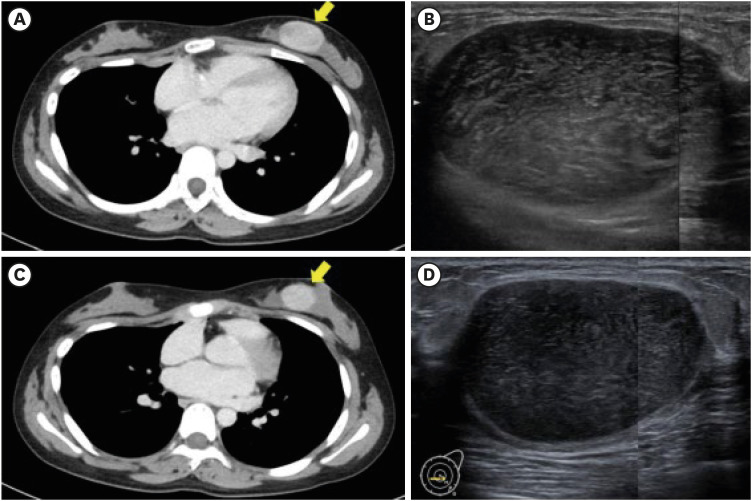
Figure 1. Pre- and post-chemotherapy changes on contrast-enhanced computed tomography and ultrasonography. (A) Contrast-enhanced CT reveals a circumscribed mass measuring approximately 40 mm before chemotherapy. (B) US shows a circumscribed oval mass measuring approximately 50 mm before chemotherapy. (C, D) Post administration of chemotherapy, the mass is reduced in size without alterations in its properties and measures approximately 30 mm and 37 mm on contrast-enhanced CT and US, respectively.
CT = computed tomography; US = ultrasonography.

