Figure 3.

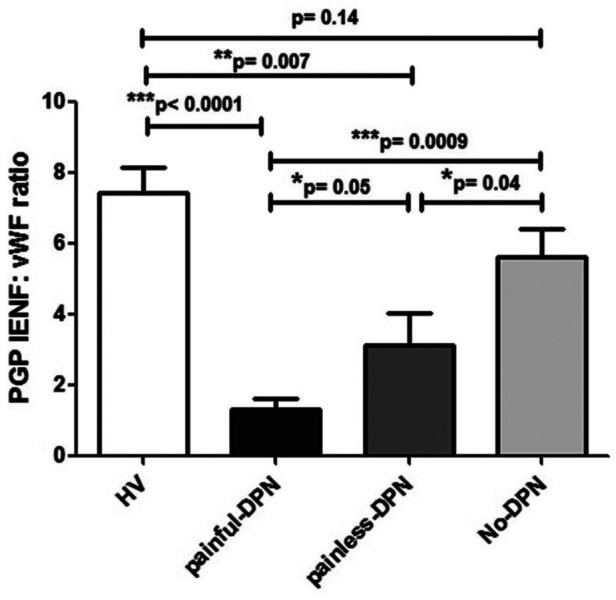
Bar charts showing image analyses (mean ± SEM) of PGP9.5 IENF: vWF ratios in thigh skin from the healthy volunteers and the HV, painful-DPN, painless-DPN, and no-DPN groups.

Bar charts showing image analyses (mean ± SEM) of PGP9.5 IENF: vWF ratios in thigh skin from the healthy volunteers and the HV, painful-DPN, painless-DPN, and no-DPN groups.