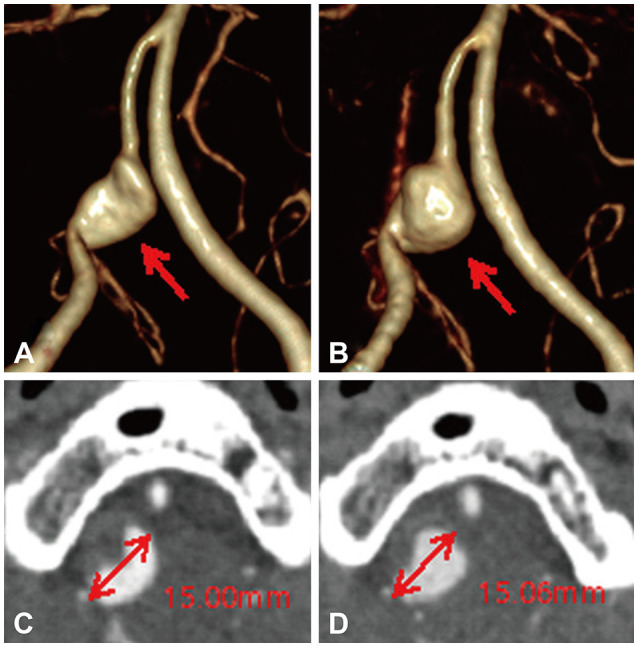
Fig. 3. Image of growth in the right iVADA. A: At the initial presentation, three-dimensional CTA demonstrated the pearl-and-string sign with dilatation (arrow) of the right VA where it branched from the posterior inferior cerebellar artery. B: 1-Year follow-up CTA showed an enlarged aneurysm sac and changes in the morphology of the right iVADA. C and D: Images showing the diameter of the dissecting aneurysm at the initial presentation and at the 1-year follow-up in axial CTA. CTA, computed tomography angiography; iVADA, intracranial vertebral artery dissecting aneurysm; VA, vertebral artery.

