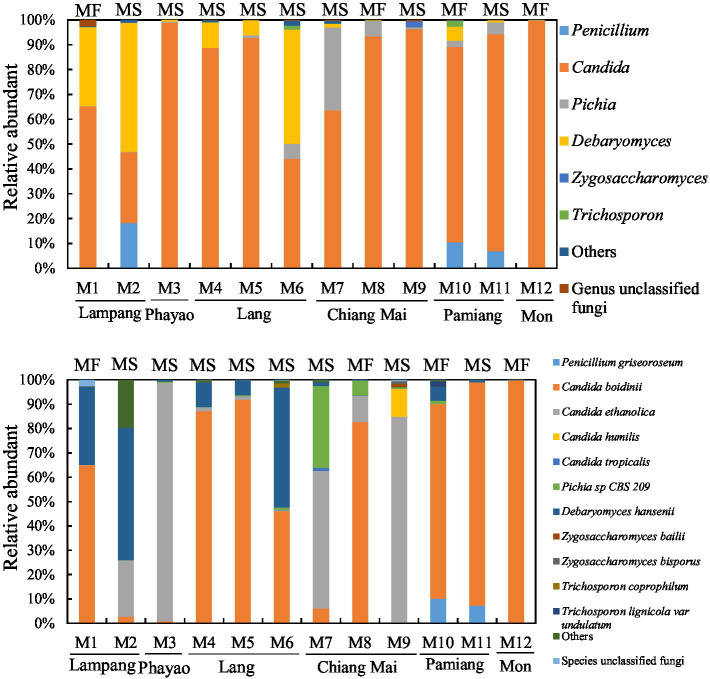
Figure 3.
Fungal flora of Miang below the family level. Upper and lower graphs show the results of fungal flora at the genus and species level, respectively. DNA was extracted from the Miang samples, and the fungal flora was analyzed by ITS2 amplicon sequencing. “Others” includes orders, families, or genera that accounted for less than 1% in all samples. “MF” and “MS” indicate “Miang-Faat” and “Mian-Som,” respectively.

