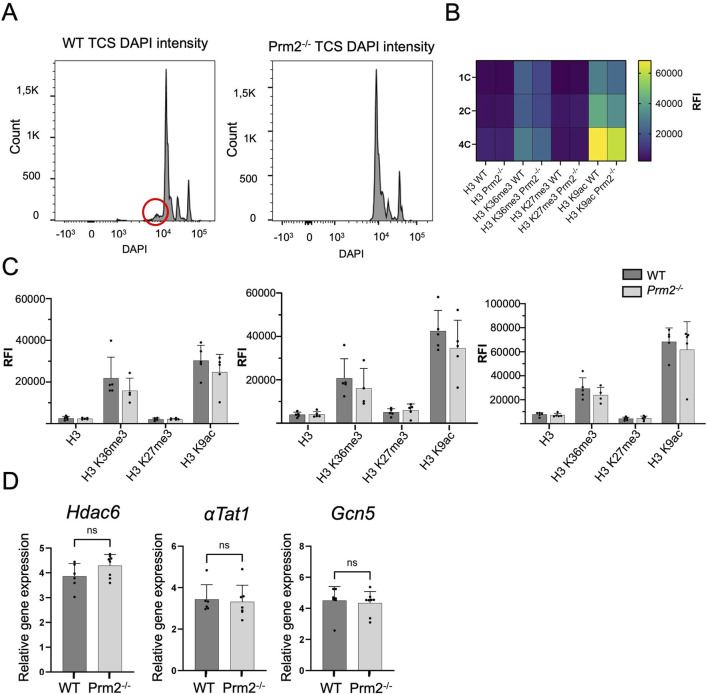
FIGURE 1.
Protamine 2 deletion resulted in histone abundance in testicular cells. (A) Distribution of testicular cells based on DAPI intensity (ploidy). The red circle indicates sub-haploid cells present only in WT mouse testis. (B) Heat map summarising relative fluorescent intensity (RFI) of all histones stained in all cell populations in both WT and Prm2−/− testicular cells. 1C - haploid cells; 2C - diploid cells; 4C - tetraploid cells. n = 5, t-Test, at least 50,000 events were recorded for each measurement. (C) Comparison of RFI of individual histones in WT and Prm2−/− in testicular cells. (D) qPCR showing no difference in relative gene expression of Hdac6 (Histone deacetylase 6), αTat1 (Alpha-tubulin N-acetyltransferase), and Gcn5 (General control non-depressible 5 also called lysine acetyltransferase 2A) in testicular cells. n = 8, Mann-Whitney test.

