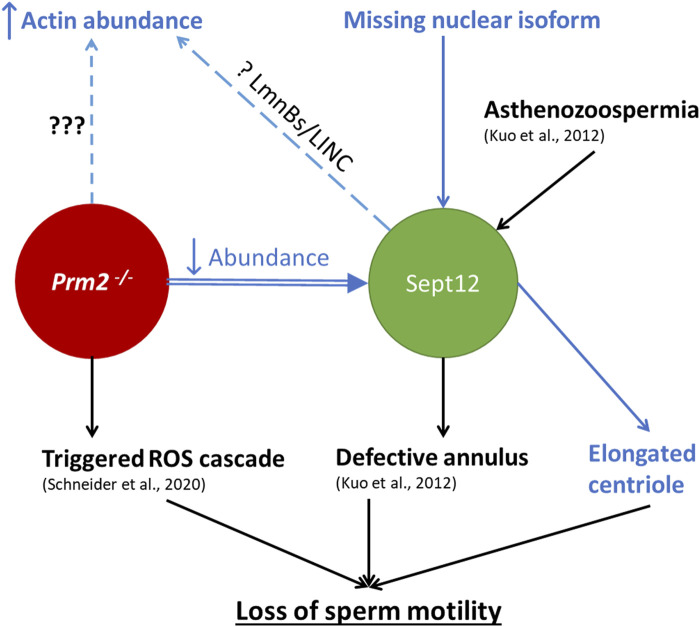
FIGURE 10.
Schematic illustration summarizing the current knowledge regarding the connection between Prm2−/− phenotype and Septin 12 role in mouse sperm. The text in blue represents the results delivered by this study. Arrows up/down represent increased/decreased effect on the described mechanism, dashed lines represent a phenotype without a described cause. ??? represents an unknown cause of the abnormality; The question mark (?) represents a possible mechanism behind the abnormality.

