FIGURE 6.
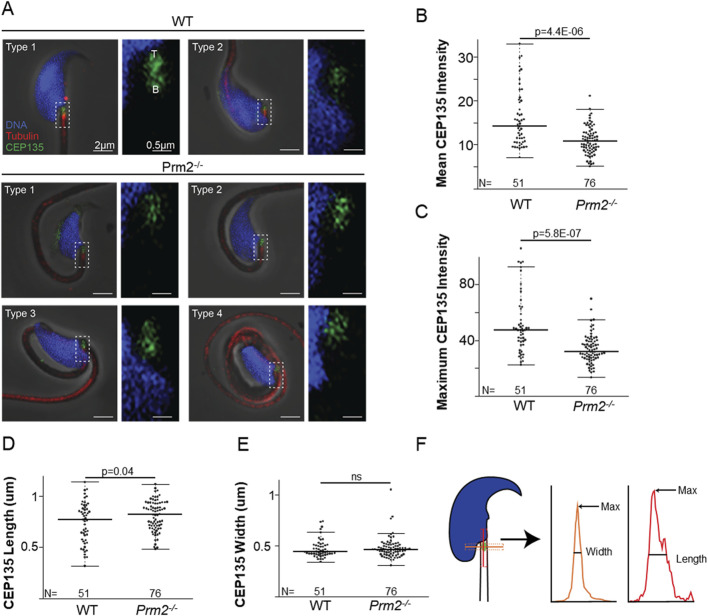
Prm2−/− spermatozoa remnant centrioles are abnormal. (A) Examples of WT types 1 and 2 spermatozoa and the four types of Prm2−/− spermatozoa. The left panel shows a low-magnification view of the sperm head, and the right panel illustrates a high-magnification view focusing on the centriolar staining. CEP135 (in green) the tail axoneme (in red), and the nucleus (in blue). All sperm were oriented with the tip of the centriole (T) at the top of the image and the base of the centriole (B) at the bottom. Scale bar = 2 and 0.5 µm, respectively. (B) Graph illustrating CEP135 mean intensity. The wild-type spermatozoa average intensity was 15.92 ± 6.46 (n = 51), and the average for the Prm2−/− was 11.00 ± 3.13 (n = 76), p = 4.4E-06. (C) Graph representing CEP135 maximum intensity. The average maximum intensity for the wild-type sperm was 51.36 ± 21.07 (n = 51), and for the Prm2−/− sperm was 33.62 ± 10.22 (n = 76), (p = 5.8E-07). (D) The average CEP135 length of the WT sperm was 0.74 ± 0.20 μm (n = 51), and the Prm2−/− was 0.81 ± 0.15 μm (n = 76), p = 0.04. (E) The average CEP135 width of WT sperm was 0.47 ± 0.09 μm (n = 51), and of the Prm2−/− was 0.48 ± 0.10 μm (n = 76), p = 0.705. (F) Schematic illustration showing CEP135 length and width measurement strategy. Width is shown in orange, and length in red.

