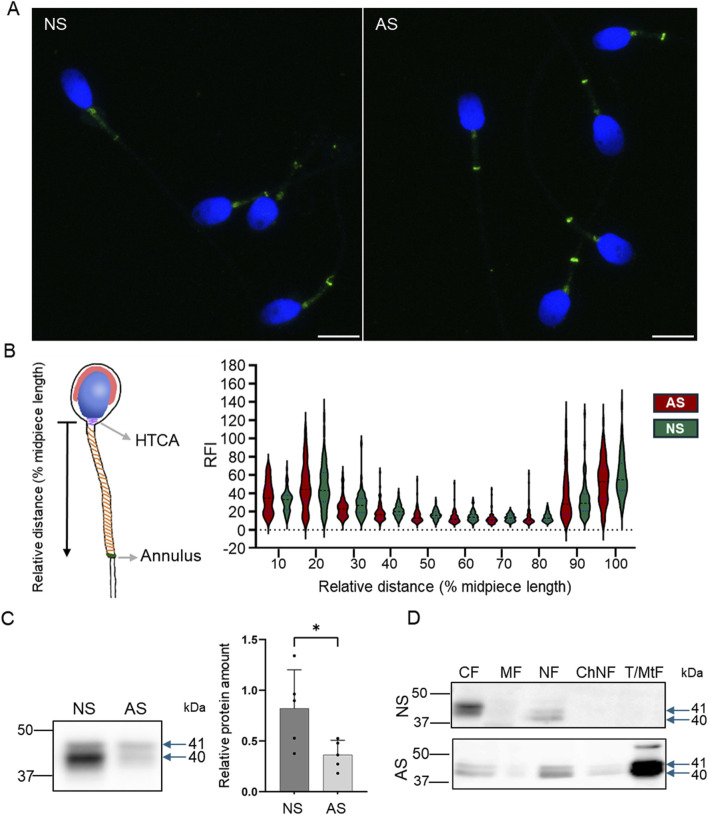
FIGURE 9.
Septin 12 distribution is modified in human asthenozoospermic sperm. (A) Comparison of localization of Septin 12 between NS (normozoospermic) and AS (asthenozoospermic) men. Scale bar = 10 µm. (B) Graphical visualization of the relative length measurement. The graph shows changes in the relative fluorescence intensity of the Septin 12 signal in the sperm midpiece. Measured relative fluorescent intensity (RF) was compared based on the relative distance (percentage) from the neck. n = 3, at least 20 sperm from each patient were measured. t-test, no significant results. (C) Western blot shows a decreased abundance of Septin 12 in AS sperm. Blue arrows indicate the molecular size of antibody-detected bands. The graph represents Relative protein amount quantification. n = 5, Mann-Whitney test, p = 0.0317. (D) Subcellular fractionations of human sperm and Western blot detection of Septin 12. CF - Cytoplasmic fraction; MF - Membrane fraction; NF - Nuclear fraction; ChNF - Chromatin-bound nuclear fraction. T/MtF -Tubulin/mitochondria protein fraction.

