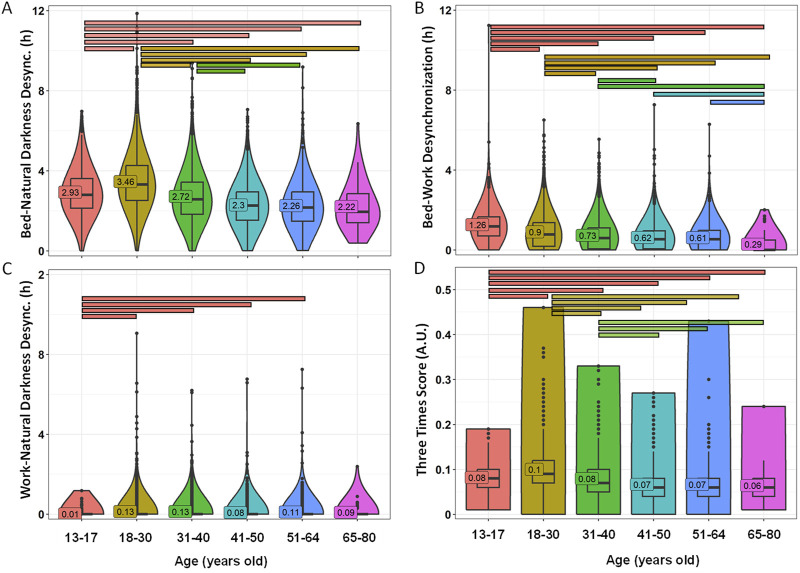
FIGURE 8.
Desynchronization indexes by age groups. Bed-natural darkness (A), bed-work (B), work-natural darkness (C) desynchronizations and Three Times Score (D). Violin plots represent the kernel density estimation, with median, first and third quartiles represented in box plots. The mean is indicated as a number in decimal format. The Kruskal-Wallis test was performed to compare age groups; significant differences among age groups (p < 0.0013) are indicated by color-coded horizontal bars.

