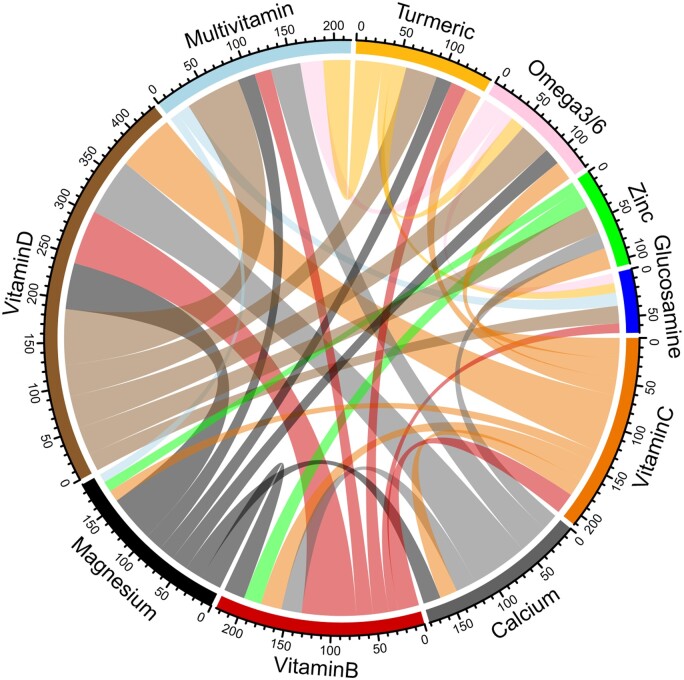
Figure 3.
A chord diagram displaying the most common overlaps between the top 10 supplements. The diameter of the chord diagram is divided into groups of the 10 most common supplements, where the length of each arc is proportional to the total overlap count for each supplement. The count around the outer rim of the chord provides the overall count of supplements per group. Based on the diagram, vitamin D has the highest overlap count overall, followed by multivitamins, vitamin C and vitamin B. The thickness of the chord between supplements represents the number of participants who use both supplements. Thicker chords indicate higher numbers of participants using those supplements

