

Abstract
The NASA Perseverance rover discovered light-toned float rocks scattered across the surface of Jezero crater that are particularly rich in alumina ( ~ 35 wt% Al2O3) and depleted in other major elements (except silica). These unique float rocks have heterogeneous mineralogy ranging from kaolinite/halloysite-bearing in hydrated samples, to spinel-bearing in dehydrated samples also containing a dehydrated Al-rich phase. Here we describe SuperCam and Mastcam-Z observations of the float rocks, including the first in situ identification of kaolinite or halloysite on another planet, and dehydrated phases including spinel and apparent partially dehydroxylated kaolinite. The presence of spinel in these samples is likely detrital in origin, surviving kaolinitization, pointing to an ultramafic origin. However, the association of low hydration with increased Al2O3 abundances suggests heating-induced dehydration which could have occurred during the lithification or impact excavation of these rocks. Given the orbital context of kaolinite-bearing megabreccia in the Jezero crater rim, we propose an origin for these rocks involving intense aqueous alteration of the parent material, followed by dehydration/lithification potentially through impact processes, and dispersion into Jezero crater through flood or impact-related processes.
Subject terms: Geochemistry, Mineralogy, Inner planets
Aqueous alteration followed by dehydration and dispersion into Jezero crater is indicated by the identification of kaolinite or halloysite, spinel and a dehydrated Al-rich phase in spectroscopic observations of light-toned float rocks by the Perseverance rover
Introduction
Recent missions to Mars have aimed to constrain its habitability throughout time and to search for signs of life, particularly at locations that show evidence of water-rock interactions, given that on Earth life exists where there is water1. However, the timing, intensity, and extent of aqueous activity across Mars’ surface are still inadequately constrained, as are the roles of impact and volcanic processes in supporting or disrupting a potentially habitable ancient Mars. The Perseverance rover is exploring the western area of Jezero, a 45 km-diameter Noachian-aged ( ~ 3.8–4.0 Ga) impact crater located along the northwest rim of the 1900 km Isidis basin and northeast of the volcanic province of Syrtis Major2,3. The rover has thus far explored the crater floor and the western sedimentary fan deposit emanating from Neretva Vallis in an effort to constrain the geological history of the area and collect astrobiologically relevant samples for eventual return to Earth. The fan has been interpreted as a river delta deposit that formed within a lake system during the Late Noachian to Early Hesperian epochs ( ~ 3.6–3.8 Ga)4. The watershed feeding this system encompasses an extensive and geologically complex region to the northwest that includes a heterogeneous collection of Noachian basement materials, impact ejecta from the Isidis basin, and aqueously altered materials4,5. As such, geological materials within Jezero crater likely contain a mixture of Martian sediments derived from volcanic and sedimentary processes in addition to deeper crustal materials that are excavated by the Isidis impact and may be represented in the Jezero crater rim as megabreccia6. Here, we present observations by SuperCam and Mastcam-Z of twelve light-toned, loose fragments of rocks (’float’) with an unusually high Al content, variable degrees of hydration, and reflectance spectral signatures indicative of kaolinite and spinel, that were investigated between sols 554 and 782. This is the first time apparent kaolinite and spinel have been detected by Mars ground-based observations and may represent the first rover detections of such aqueously altered crustal rocks observed in situ, potentially modified by later impact, burial or igneous thermal processes.
Results
Since landing at the Octavia E. Butler landing site, over 4000 candidate light-toned floats have been identified in Mastcam-Z images, either as individual detections or occurring as accumulations of sand to gravel grain sizes. They are distinguishable from the dark-toned volcanic units of the crater floor in rover images and usually reside in local topographic lows (Fig. 1).
Fig. 1. Rover traverse and light-toned float rocks detection.

HiRISE color basemap showing rover traverse (gray line) through Sol 800 (May, 2023). Insets show locations of the Three Forks, Knob Mountain, and Echo Creek examples of light-toned float rocks. Locations of identified light-toned rocks are indicated along the traverse with a color/shape code related to their size. SuperCam targets (circled in red) are the ones studied in this paper. The yellow star is the rover position on Sol 800. Panel B: Sol 72 Tselhgai (tsé łigai) target observed by Mastcam-Z at 110mm focal length in approximate natural color (zcam08033). Panel C: Sol 385 portion of La Orotava western crater rim observed by Mastcam-Z in approximate natural color at a 110 mm focal length (zcam08413). Panel D: Sol 711 portion of Jenkins Gap observed by Mastcam-Z in enhanced color at 63 mm focal length (zcam08715).
Specific float rock targets were given informal names by the Mars 2020 mission operations teams (Tables S1; S2). These names will be used to designate the rocks throughout this manuscript. The light-toned float rocks exhibit various shapes from subangular to subrounded and range in size from 0.5 cm to ~ 30 cm along the long axis (Figs. 2 and S1). They display several textures at the mm- to cm-scale, as observed in short-range images taken by the SuperCam Remote Micro-Imager (RMI): most rocks contain both small (< 2 mm in diameter) pits and large pits (> 2 mm in diameter) (Figs. 2 and S1). Some float rocks have wavy/discontinuous apparent layering/laminations such as targets AEGIS 701A and Finch Lake (Fig. S1 F, G), some have a smoother, pitted surface such as Barrier Range (Figs. 2F and S1 H), while others have a texture significantly disrupted by the presence of large pits such as Unga Island (Figs. 2E and S1 K). Only one light-toned float, Dolgoi Island, has dark-toned mm-scale features that occur on some faces (Figs. 2D and S1 E). We interpret these features as likely mineral grains or clasts, although SuperCam spectral observations did not overlap any of these features so we are unable to confirm their mineralogy. Luster varies across the float rocks and is typically dull, potentially relating to dust cover, with the exception of Ouzinkie that has a pearlescent luster (Figs. 2A and S1 J). Dark-toned coatings that are also common on the other Jezero rocks7 are present on many of the float rocks. Coatings usually occur within larger pits and cover the flat surfaces of the rocks (Figs. 2B and S1A, B, I). Coatings in pits are discriminated from possible mineral grains due to the dull luster and round shape of the pits in contrast with the more reflective, angular surface of the dark grains present within these rocks.
Fig. 2. Texture/morphology and spectral modeling of the light-toned float rocks.

Images: SuperCam RMI color images showing various types of textures. A Image of Ouzinkie showing the shiny luster (scam02691); B image of Chignik showing the abundant dark, dull lustered grains within a pale, light-grey matrix (scam01681); C image of Rainbow Curve highlighting a discontinuous and anastomosing tendency of the layered targets (scam01777); D image of Dolgoi Island with yellow arrows pointing to dark green candidate spinel grains ( ~ 1 mm diameter) (scam01657); E image of Unga Island highlighting vitreous, spatter-like texture intermingled with large pits up to 4 cm in diameter (scam01676); F image of Barrier Range showing the smooth, aphanitic/very fine-grained nature of the smooth targets that commonly contains small, spherical pits sometimes filled with a dark coating material (scam02554). Iris chart: representation of the mixing coefficients of all the modeled targets segregated into mineral families (color scheme). Each sector corresponds to a raster points on a target (the number of the raster point is indicated at the outside edge of the sector). The proportions shown here are not linearly linked to mineral abundances, but rather represent the relative weight of each mineral family in the representation of the spectrum. The mixing coefficients are normalized and coefficients whose likelihood is lower than 1 are removed (white spaces, see Methods section and Fig. S9).
Elemental compositions
Elemental compositions of SuperCam’s observations (Table S1) were analyzed using the Laser Induced Breakdown Spectroscopy (LIBS) technique of SuperCam (see relevant papers8,9, Methods section and Supplementary Text S1). The major outstanding feature of these targets is their high Al abundances, which ranges between 17 wt% and 48 wt% Al2O3 (Figs. 3, S2), with an average of 34.6 ± 6.6 wt% (1-standard deviation).
Fig. 3. Chemistry of the light-toned float rocks.
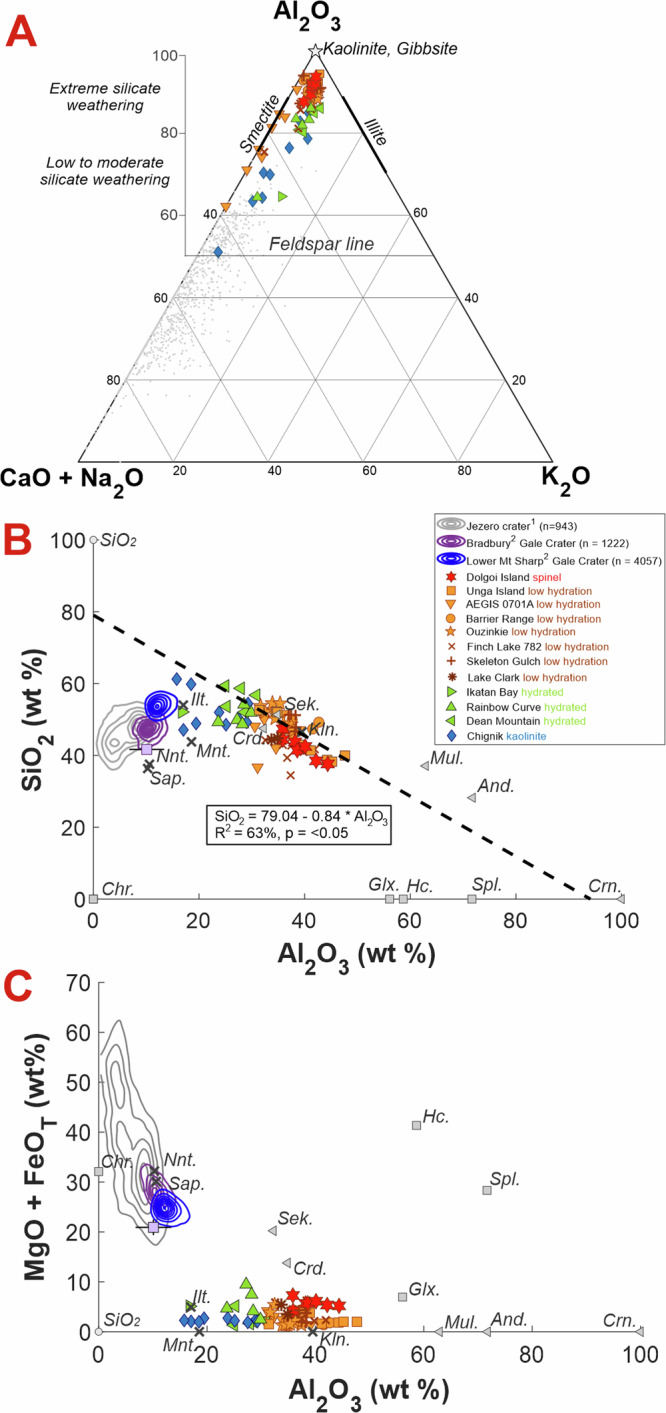
Plots showing the SuperCam LIBS chemical data for points on the float rocks that have not sampled coatings. SuperCam data are colored according to the strength of hydration bands in the IR data (very low is red, high is green) and the strength of the kaolinite bands (blue). A A-CN-K plot, typically used to estimate the degree of weathering experienced by sediments on the Earth30. Points that plot above the feldspar line are indicative of chemical weathering which preferentially enriches Al2O3 over CaO, Na2O and K2O for feldspar-bearing sediments. The illite and smectite fields are highlighted on this plot and grey point data for bedrock analyzed in the Delta front campaign by the SuperCam instrument are plotted as a comparison. B and C are biplots showing the chemical variation of SiO2, MgO and FeOT with Al2O3 for the light-toned float rocks compared to density contours of ChemCam data of the fluviolacustrine Bradbury and lower Mt Sharp group units in Gale crater and the SuperCam delta front bedrock data. Select phyllosilicate (crosses), spinel (squares), and aluminosilicate (triangles) mineral data are shown alongside SuperCam data. B also shows the linear regression results for these variables. 1All SuperCam data up to Sol 78260, 275. Nnt. = nontronite, Mnt. = Montmorillonite, Ilt. = Illite, Sap. = Saponite, Kln. = Kaolinite, Mag. = Magnetite, Glx. = Galaxite, Hc. = Hercynite, Spl. = Spinel, Crn. = Corundum, And. = Andalusite, Mul. = Mullite, Sek. = Sekaninaite, Crd. = Cordierite.
Al2O3 abundances are anticorrelated with SiO2 across all targets. Considering the points with major-elements totals > 90 wt% (Table S3) and not contaminated by coating materials, the correlation coefficient (R2) is 0.63 (Fig. 3B). LIBS H peak areas also systematically decrease with increasing Al2O3 (Fig. S3 D). Other element abundances do not share a statistically significant correlation with Al2O3 (Fig. S2). All major oxides except Al2O3, SiO2, and K2O have lower average abundances than in most of the more basaltic rocks observed to date by SuperCam in Jezero crater. This is especially true for FeO and MgO (Fig. 3C), given the prominence of olivine and pyroxene in the crater (e.g., Fig. 3)10–12.
Dolgoi Island exhibits some of the highest Al2O3 abundances (39.3 ± 3.2 wt%) and lowest SiO2 abundances (42.2 ± 3.4 wt%) with very little hydration signatures in near-infrared (NIR) spectra compared to the other targets (see next section). It also exhibits the highest average (but still very low in comparison to Jezero crater terrains), FeOT abundances (4.4 ± 0.7 wt% compared to > 20 wt% all-mission average), and the lowest CaO, Na2O, and K2O abundances (Fig. 3A), with the strongest negative correlation between SiO2 and Al2O3 at 0.88 R2.
Low-hydration targets (Unga Island, Ouzinkie, AEGIS 701A, Barrier Range, Lake Clark, Skeleton Gulch, and Finch Lake #1–6) are intermediate in Al2O3 and SiO2 abundances. They exhibit low abundances of FeOT (< 4.0 wt%), MgO (< 2.0 wt%), Na2O (< 1.5 wt%), and K2O (< 2.5 wt%). Targets AEGIS 701A and Finch Lake have some considerable scatter towards high CaO abundances (up to 5.6 wt%) that correlates with lower totals (< 90 wt%), but overall CaO abundances are 1.3 wt% ± 1.5 wt%.
Light-toned float targets with the greatest LIBS H peak areas and strongest hydration signals in the NIR data (Chignik, Dean Mountain, Finch Lake #7–10 and Rainbow Curve, see next section) exhibits the highest SiO2 abundances (53.3 ± 3.9 wt%), the lowest Al2O3 abundances (25.6 ± 4.3 wt%), and high average K2O (2.0 ± 0.3 wt%). Targets from this group also have notable scatter in FeOT, CaO, and Na2O to abundances greater than the average, but this scatter appears to trend towards the coatings composition suggesting contamination despite best efforts to reduce the inclusion of coatings on the chemistry (Fig. S2).
Three minor and trace elements are enriched in these rocks. Chromium abundances generally range between 1500 and 3500 ppm (Table S3; Jezero mean is 900 ppm). Titanium is generally elevated (mean TiO2 = 0.94 wt% relative to Jezero mean rocks of 0.42 wt%), but some points are particularly elevated (up to 2 wt%) in Chignik and Dean Mountain (Table S3). Ni also appears strongly enriched in a few points in a number of the targets. Some observations show > 1 wt% Ni (Fig. S3) and a Ni/(Fe+Mg) ratio > 1.0. (Ni is not normally detected by SuperCam and is expected to be typically < 0.1 wt%.) Ni, Cr, and Ti enrichments do not appear correlated with each other or with any of the major elements. Manganese is not particularly enriched (all points < 1 wt% MnO; see Supplementary Text S1), and other siderophile elements such as Co, Zn, and Pb are not detected.
Reflectance spectroscopy
Near-infrared (1.3–2.6 μm)
Near-infrared (NIR) relative reflectance spectra are important indicators of the degrees and types of alteration that rocks have undergone due to the presence of diagnostic, prominent absorption bands for water and OH anions, metal-OH, CO3 and other bonds associated with secondary mineral phases13,14. The targets described here exhibit substantially different spectral features in SuperCam’s Infrared Spectrometer (IRS;14 and radiometric calibration details in the Methods section) data compared to all other rocks analyzed by Perseverance, which, when compared with the chemical composition given by LIBS, enable trends to be identified (Figs. 4A; 5; S4, and S5).
Fig. 4. Relative reflectance spectra of light-toned float rocks.

A Mean SuperCam (solid line) and Mastcam-Z (points with solid line) spectra for targets representative of the dataset spectral diversity, where the colored envelope represents the amplitude of variation of the reflectance along the raster for SuperCam. Variation bars on Mastcam-Z spectra indicate the standard deviation within the selected region of interest. The main spectral features are indicated by arrows. Each color corresponds to a spectral class: dark blue/dark green = high hydration group; orange/red = low hydration group (two targets are represented to show the 1.5 μm downturn). Coated targets are represented in pink. Also see Figs. S4 and S6. B Laboratory reference spectra of relevant minerals (see Table S5). Grayed parts correspond to SuperCam blind spectral regions.
Fig. 5. LIBS Al2O3 and H-content compared to the IR hydration band depths, and band positions.

Al2O3 content compared to band depth of the 2.2 μm band A and the 1.9 μm band B. H score (normalized by the oxygen line) of the studied targets as a function of 1.9 μm band depth C and Al2O3 content D. E shows the relationship between the 1.4 (Al-OH, H2O) and 2.2 μm (Al-OH, Si-OH) bands. The corresponding relation for lab minerals is indicated as colored patches, highlighting the diversity of compositions exhibited by the band positions. The color scheme is the same as in Fig. 4, grey points are all other SuperCam measurements through Sol 800. The size of the point indicates the band depth-to-noise ratio (BDNR) of the 2.2 μm band, representing the quality and the reliability of the detection of this feature (see Methods section).
The main spectral difference between the targets is the strength of absorption bands related to aqueous alteration: we distinguish hydrated targets, for which the 1.4 (H2O and metal-OH), 1.9 (H2O) and 2.2 μm (Si-OH and Al-OH) bands are deep and detected above the noise level, from less hydrated targets for which these bands are shallow to absent (< 2% band depth).
The 2.2 μm band is one of the most remarkable spectral features of the targets studied, with respect to all the measurements made with the IRS since the beginning of the mission. Although, several detections of this feature were reported in the crater floor rocks, but the band depth did not exceed 1 to 2%15,16. In the light-toned float rocks, the band depth (noted as BD2200) is up to 14% in Chignik. The 1.4 and 2.2 μm bands show some variability in position and shape: Chignik exhibits two doublets at 1.4 and 2.2 μm with minima at 1.396 & 1.407 and 2.163 & 2.195 μm (Fig. 4A and 5E) characteristic of the Al-OH bond in 1:1 phyllosilicates such as kaolinite and halloysite (Fig. 4B). Of note, the 2.2 and 1.4 μm doublets of Chignik are low in contrast, which would suggest a poorly crystalline phase and/or a mixture with Al-smectites17 or an exposure to high pressure, related to shock metamorphism18,19. Dean Mountain, Finch Lake, and Rainbow Curve do not show clear doublets, but their band positions are consistent with kaolinite/Al-smectite mixtures (Fig. 5E). Trayfoot Mountain shows a 1.4 μm band centered at 1.43–1.44 μm, possibly attributable to H2O in sulfates or zeolites, whereas its 2.2 μm feature is consistent with Al-OH. Finally, Ikatan Bay’s absorption features are consistent with a mixture of Al-OH and Si-OH, as shown by the 1.4 and 2.2 μm band positions and its lower Al content (Fig. 5A, B) and higher Si content (Fig. S5). But this target (as well as Lake Clark) is heavily coated which may bias the estimate of Al and Si content from LIBS and IRS. The NIR spectral signature of the coating is not clear but it tends to be enriched in Fe (weak bands at 2.28 and 2.39 μm, Fig. S4).
In parallel with the 1.4, 1.9, and 2.2 μm bands, Chignik and Dean Mountain exhibit a weak absorption band at 2.39 μm, attributable to the Fe-OH bond in some smectites and kaolinites13.
Dolgoi Island shows a remarkable spectral feature that comprises a very broad (from 1.4 to 2.55 μm) and deep (> 10%) band similar to some spinel or aluminosilicate (sillimanite, staurolite) group minerals with Fe impurities (Fig. 4B) and attributable to Fe2+ absorption20. However, several other targets also exhibit a negative slope (e.g., Barrier Range, Skeleton Gulch, Unga Island, Finch lake) and a slightly concave shape, favoring the presence of a low amount of spinel and/or aluminosilicate, as discussed below (Fig. 2).
Visible (0.40–1.02 μm)
Observations using the visible (VIS) portion of SuperCam spectra (0.40 – 0.85 μm) and Mastcam-Z multispectral imaging (0.44–1.02 μm) provide additional details regarding the spectral variability of the light-toned float rocks. Three spectral classes are identified using the VIS spectra (Figs. S6, S7) that exhibit: (1) positive, steadily increasing near-infrared spectral slopes (e.g., Chignik, Finch Lake #7 – 10); (2) peak reflectance positions near 0.75 – 0.80 μm flanked by downturns on either side (e.g., Ouzinkie, Lake Clark, Rainbow Curve, Peppermint); and (3) spectrally neutral/flat slopes > 0.75 μm (e.g., Unga Island, Dolgoi Island, Skeleton Gulch). As noted, some targets exhibit two class types on the same rock surface (e.g., Finch Lake #7 – 10 vs. Finch Lake #1 – 6; cf. Fig. 2C). Similarly, multiple classes of float rocks were observed within some Mastcam-Z scenes. For example, in decorrelation stretch images using the 1022 nm, 910 nm, and 800 nm filters of the Unimak Island area (Sol 677, Fig. S7), rocks in Class 1 appear in yellow hues, whereas those in Class 2 appear as cyan. The greater spatial coverage afforded by Mastcam-Z multispectral images enables a broader accounting of potential light-toned rock populations than provided by the relatively few SuperCam targeted observations (cf. Fig. 1).
Modeled mineral composition
To compare the relative shape and intensity of SuperCam spectral features in the 1.3–2.55 μm region to laboratory spectra, we used a linear mixture approach whereby a Martian spectrum is modeled using a weighted average of laboratory spectra (details are provided in the Methods section). The main strength of this technique is its ability to determine the mineral phases most likely to describe the data and, therefore, to be present in the mixture. Note, however, that, the values of the mixing coefficients (i.e., their weighted average) are intended to describe only the similarity of a given spectrum to a combination of selected laboratory spectra (endmembers) and are not linearly related to the abundances of those minerals in the rock.
In the case of the targets in our study, the same set of endmembers was tested for all the targets to show the relative distribution of mixing coefficients, and only those with a mixing coefficient greater than 1% were retained (see Methods section for more details). The spectrum of a given mineral may vary with its grain size, porosity, concentration of impurities, and the inherent nonuniqueness of linear spectral modeling makes it difficult to distinguish similar from each other. Thus, the minerals selected were grouped into families to compensate for those differences (see Table S4). All the laboratory spectra used in spectral modeling are listed in Table S5. The relevance of the spectral library is discussed in Supplementary Text S3.
Figure 2 gives a visual representation of the relative presence of each mineral family in the mixture. The difference between hydrated and less hydrated targets is clearly visible, with a much greater contribution of anhydrous and Al-rich phases (such as Al-spinels, in red) in the latter, whereas the former are more marked by assemblages of hydrated phases corresponding to aqueous alteration minerals (Al-rich smectites, illite, kaolinite). Of note, spinel minerals are modeled as present in most of the points to account for the general concavity of the spectra.
Finally, almost all the targets are modeled with some proportion of sulfate minerals, mainly Fe and Mg-bearing species, that may explain the longward shoulder of the 1.9 μm band. While no S is explicitly observed with LIBS, its detection limit is high, at about 10 wt% SO3, allowing the possibility of some minor sulfates contributing to the IR spectra. Sulfates are also inferred to be responsible for the 2.3 μm peak observed in less hydrated targets, associated with a weak 2.2 μm band (Fig. S8).
Discussion
Most rocks on Mars are igneous or volcaniclastic in origin and can typically be linked to an igneous precursor. However, the low MgO, FeOT, and CaO abundances of these rocks does not support that they are igneous, and suggests that they have been extensively altered (Table S3).
It is critical to acknowledge that float rocks have been fully removed from their geological context which fundamentally limits our ability to understand their origin and complete alteration history. However, mineralogical and imaging data from orbital spacecraft can be used to identify possible sources of these float rocks within and around Jezero crater. With these considerations in mind, we can use the geochemistry and inferred mineralogy of these samples to propose a sequence of events to constrain the origin and emplacement of these materials into Jezero.
Here, we detail the possible formation scenarios of the main mineralogical endmembers in relation to the LIBS-derived chemistry, putting it into context with the local geology of the Jezero crater and Nilli Fossae region. This conceptual model uses constraints from terrestrial analog materials and Gale crater bedrock to contextualize these new observations.
Origin of high Al, hydration, and kaolinite
The light-toned float rocks in the Jezero crater have the highest Al abundances so far analyzed in any Martian rock investigated at the surface with landed missions or through meteorite studies. The highest Al/Si content previously reported in situ was measured in altered rocks by the Mars Exploration Rover Spirit at the Columbia Hills and exhibited compositions consistent with montmorillonite (an Al-rich, Fe/Mg-poor smectite) with 10 – 20 wt% Al2O321. From orbit, the most widespread Al-rich materials on Mars are globally distributed horizons that are spectrally dominated by Al-clays, including kaolinite/halloysite22. Widespread detections of light-toned Al-rich clay minerals overlying Fe/Mg clay minerals span tens to hundreds of meters of vertical stratigraphy at each location22–25. These kinds of sequences have not been observed in situ to date, but deposits representative of these processes appear to be present in the Nili Fossae region beyond the Jezero crater6,23,26. These Al-rich horizons are hypothesized to have formed in the early to mid-Noachian due to intense subaerial (pedogenic) alteration and have been proposed to be either deep weathering profiles22–25 or sequences of paleosols27. In either case, Al-rich materials likely represent prolonged aqueous alteration of a mafic or felsic protolith to produce phyllosilicates, such as kaolinite, halloysite (both Al2Si2O5(OH)4), and montmorillonite ((Na,Ca)0.3(Al,Mg)2Si4O10(OH)2 ⋅ n H2O). Like the characteristically light-toned, bleached “pallid" zone of terrestrial laterite and/or bauxite, these light-toned materials do not appear to retain significant quantities of total Fe (less than ~ 4 wt. %), possibly due to Fe dissolution/reprecipitation during weathering. This could have proceeded as leaching under variable redox conditions based on stratigraphic position in a paleo-weathering profile (e.g., “bleached" horizon at/below a fluctuating water table)24 or, in contrast, overall weathering profile development under a Noachian reducing atmosphere, where Fe is lost during leaching28.
Although the Martian crust is primarily mafic in composition, and thus relatively Al-poor (bulk estimate: ~10.5 wt% Al2O3;29), it does not preclude the formation of an Al-rich and kaolinite-bearing horizon through surface weathering, as demonstrated by the lateritic profiles developed over ultramafic bedrock on Earth23.
For the light-toned rocks in Jezero crater, the high Al2O3 and very low abundances of all other major cations aside from K2O are supportive of intense leaching in a deep weathering environment (Fig. 3A). The chemical index of alteration (CIA, defined as molar Al2O3/(Al2O3 + CaO + Na2O + K2O)30) for these rocks is extreme, with some points above 95 and the majority above 88 (Table S3). This is much higher than portions of the Murray formation in Gale crater that were described as having experienced moderate alteration, with CIA values up to 6331,32.
The presence of Ni enrichments in these high-Al rocks also supports the hypothesis that they originated from intense pedogenic alteration. Ni-rich laterites are found in tropical regions of the Earth and exhibit specific and separate zones of Ni and Mn enrichment. Ni is potentially present in clays of the talc-pyrophyllite group, such as willemseite (Ni3Si4O10(OH)2) or 1:1-phyllosilicates, e.g., pecoraite or nepouite (both Ni3Si2O5(OH)4)33,34. The high Ni/(Mg + Fe) ratio, which is unusual on Earth, suggests depletion of Mg and Fe, potentially by leaching with fluids of variable redox state24.
Alternatively, Al-rich materials on Mars have been considered as the alteration products of lacustrine35 or hydrothermal processes36, or, when found with sulfates, formed from acidic brines in ice, mafic dust, and sulfur-rich aerosol deposits37. But the recurring Al overlying Fe/Mg stratigraphy, dioctahedral clay mineralogy consistent with low-T open-system alteration, absence of talc-chlorite-prehnite, and the thickness of the sequences (commonly 100–200 m), all observed from orbit, renders these forms of alteration less likely than precipitation-driven top-down leaching23,24. We favor the hypothesis that Al enrichment is due to leaching and not impact or hydrothermal processes based on Ni enrichment, the absence of hydrothermal minerals (e.g., sulfates of the jarosite or alunite family, hematite), and the elevated chemical index of alteration ( ~90, Table S3).
We do not observe any float rocks of the Fe/Mg horizon that would be expected to underlie the putative Al horizon. This could be explained either by the thickness of the Al horizon and the excavation mechanism not being sufficient to expose the Fe/Mg layer or that such rock fragments were more difficult to identify amongst float rocks of other origins along the rover traverse. Based on orbital observations38, float rocks derived from the Fe/Mg horizons of the compositional clay stratigraphy are likely darker albedo (due to Fe), making them harder to distinguish on Mastcam-Z images.
Mineralogically, the high hydration and presence of kaolinite and Al-clays in the near-infrared spectral modeling of hydrated targets such as Chignik is also indicative of intense leaching and aqueous alteration for these rocks.
Spinel formation scenarios
In addition to the kaolinite, the other mineral that is consistently inferred in the IR spectra is spinel. Furthermore, cm-scale, cubic, dark-toned features interpreted as minerals in the target Dolgoi Island could be consistent with spinel mineral grains (Fig. 2). Unfortunately the SuperCam LIBS observations, which have a smaller field of analysis than the IR, did not target the candidate spinels to constrain their composition. Nonetheless, the frequent identification of spinel by near-infrared spectral modeling suggests that spinel minerals may be present at a smaller grain size throughout these rocks, except in the kaolinite-rich target Chignik (Fig. 2). Spinel group minerals with their characteristic cubic crystal form are further classified based on the dominant trivalent ion (Al, Fe, Cr)39. Chromian pleonaste spinels and other spinel series minerals can form in many igneous and metamorphic environments, particularly ultramafic to mafic igneous rocks and in high-temperature metamorphic environments. As such, there are two possible formation mechanisms for spinel in these rocks: (1) the light-toned float protolith was an ultramafic to mafic igneous rock, with the spinel surviving kaolinitization, or (2) the spinel formed as a result of the heating that dehydrated these rocks.
Although the light-toned float rocks appear to be extensively altered and likely carry little resemblance to their original protolith, the presence of spinel minerals combined with the elevated Ni abundances could indicate an ultramafic precursor if they are relicts of the original rock. Spinels, particularly chromian spinels, are typically one of the first accessory phases to crystallize in mafic and ultramafic rocks and are widely considered to be resilient to alteration and low-grade metamorphism40. Spinels exist in many placer deposits around the world after the complete alteration of the original host rock41,42 and are resilient to acidic solutions43, so it is possible they could have survived the kaolinitization process. Candidate Cr- and Ti-spinels have been identified by the PIXL instrument in the sedimentary units of Jezero crater’s deltaic fan and are hypothesized to be derived from the erosion and alteration of ultramafic sediment source rocks44. SuperCam LIBS data also suggests the presence of Cr-spinels in the olivine-cumulate igneous rocks on the Jezero crater floor12. As such, the detection of spinel in the light-toned float rocks and their association with an ultramafic precursor would be consistent with previous detections of spinel in Jezero. The other possibility is that the spinel minerals could have formed from high-temperature alteration of an aluminous, kaolinite-rich precursor, such as occurs on the Earth. For example, on Earth the high-temperature metamorphism of pelitic sediments in India (up to 950∘C,45) formed spinel granulites with mineral assemblages including spinel-quartz-cordierite. At the Stromboli volcano in Italy, high-temperature metamorphism of hydrothermally altered basalts incorporated into ascending lava during an eruption created high Al2O3 (up to 31.79 wt%), moderate K2O, and low FeOT, MgO, CaO, and Na2O rocks with spinel46. However, we prefer a detrital origin for the spinels in the Jezero light-toned float rocks, as cordierite – a high-temperature mineral that should be visible in IR – is not detected in the VISIR spectra of the rocks.
Dehydration and lithification
Overall, kaolinite is a soft mineral with a Moh’s hardness of 2 – 2.5. As such, kaolin deposits on the Earth are easily eroded unless they have been subjected to lithification such as through burial diagenesis47. The high-Al float rocks in Jezero crater have been scattered > 10 km across the Perseverance rover traverse, ranging in grain size from sand to boulder, so it is reasonable to consider that these rocks must have been lithified and hardened after the initial formation of kaolinite. One indicator to the lithification process may reside in the negative correlation between Al2O3 and hydration in both the LIBS and VISIR data (Fig. 5B, D). For light-toned float rocks with minimal hydration detected in their near-infrared spectra and low LIBS H score, Al2O3 concentrations are in some cases greater than that of kaolinite (Fig. 3B). The characteristic kaolinite bands are still present for these dehydrated targets, suggesting that this phase has lost some or most of its molecular OH, consistent with the higher Al2O3 abundances in targets with lower H. Furthermore, stoichiometric modeling of LIBS data suggests that at most, 10 wt% spinel can be fit into the chemical composition of the light-toned float rocks with additional Al2O3 remaining, showing that the negative correlation between Al2O3 and hydration is not fully explained by an increased abundance of spinel. The dehydration of kaolinite requires temperatures of at least 450∘C48,49 which can be achieved through burial diagenesis on the Earth47,50. However, this would require very significant burial depths on Mars due to its significantly lower gravity, which is unlikely for a planet without plate tectonism51. Orbital data show large (> 100 m) kaolinite-bearing megabreccia blocks, excavated through impact processes during the formation of the Isidis basin6. Isidis is a 1900 km diameter impact structure that formed before Jezero, approximately 3.96 – 3.97 Ga52, which impacted altered, clay-bearing Noachian crust53. Impact processes are known to create high-temperature and/or shocked mineral assemblages so it is possible that the excavation of these kaolinite-rich deposits by impact processes may be responsible for the lithification and dehydration of these Al-rich rocks.
Transport into Jezero and summary
Boulder-sized light-toned rocks have been seen in Mastcam-Z images of the interior walls of the crater rim, which leads us to consider that kaolinite-bearing megabreccia are the most likely source of the high-Al float rocks in Jezero. Subsequent erosion of the crater rim, either by subsequent smaller impacts, fluvial or ice-related processes, and/or debris flows may have eroded and transported the float to their current positions. We note that, with the exception of light-toned blocks on the crater rim slopes, the light-toned float rocks have been found on or near the lobes and delta front and beyond that in the crater floor.
In summary, we favor an interpretation involving a sequence of events described above and illustrated in Fig. 6. We suggest a four-stage scenario: 1) intense aqueous alteration at a high water-to-rock ratio resulting in the removal (leaching) of mobile cations (Na, Ca, K, Fe and Mg) causing enrichment in relatively insoluble aluminum, and production of the more hydrated endmembers; 2) burial and lithification of an otherwise soft, kaolinite-rich rock; 3) likely impact-induced excavation and, for some rocks, partial dehydration; and 4) erosion and transportation of Al-rich material into Jezero. The details of these steps will be clearer if or when Perseverance arrives at parent outcrop material.
Fig. 6. Hypotheses for the origin, alteration, and eventual emplacement of aluminum (Al) rich material in Jezero crater, Mars.

A Intense aqueous alteration of a volcanic and/or volcaniclastic protolith (e.g., surface leaching or subsurface hydrothermal alteration) generates Al-rich clay minerals (kaolin group clays). In the case of surface leaching leading to kaolinitization, (shown in B) the Al clay horizons overlie Fe/Mg clay horizons over tens of vertical meters of stratigraphy. Note that a hydrothermal alteration schematic is not shown in B), but later heating/dehydration possibilities are the same for hydrothermal kaolinite; B Subsequent volcanic and/or impact processes altered deep weathering profile material into metamorphosed Al-rich material including dehydrated/dehydroxylated kaolinite and spinel; C subsequent transport of altered material into Jezero may have resulted from either fluvial incision and transport into Jezero or ballistic transport as impact ejecta.
Conclusion
The textures, compositions, and mineral phases of the light-toned, hydrated, Al-rich float rocks in Jezero crater are consistent with intense alteration that currently represent the strongest signatures of weathering that have ever been examined by a landed mission to Mars. Furthermore, some of these rocks show signs of potential dehydration suggesting that they may have been exposed to elevated temperatures contributing to the hardening of the originally soft kaolinite-rich rock, allowing it to be transported a significant distance downstream. The presence of kaolinite megabreccia blocks in the Jezero crater rim suggests that these float may represent fragments of impact excavated, Noachian weathering profiles. Despite a lack of geologic context, what is confirmed by these float rocks is the presence of kaolin-group minerals, which are phases that have been observed from orbit in thousands of locations across the Noachian terrains of Mars. Based on terrestrial knowledge, such mineral phases represent the absolute endmember of prolonged aqueous alteration.
The source of these float rocks may represent the oldest and most aqueously altered material that currently exists on the surface of Mars today. Several key questions remain regarding the nature and origin of these Al-rich materials, including the composition of the protolith, the chemistry, redox state and total volume of alteration fluids, the duration of weathering, and, critically, the location of an in-place outcrop from which this material originated. The presence of a purple coating on many of these rocks is similar to the purple coatings present on several geological units and basaltic float rocks in the Jezero crater, suggesting that the light-toned rocks were deposited with sufficient time for this coating to form7. Based on the implications these rocks have for understanding the ancient Mars climate and its relationship to volcanic and/or impact processes, these float rocks and their in situ source outcrop(s) will be important targets for future sampling with the Mars 2020 mission.
Methods
Data processing and calibration
LIBS elemental compositions
Elemental compositions were analyzed using the Laser Induced Breakdown Spectroscopy (LIBS) technique of SuperCam8,9. Rasters of up to ten points are interrogated by 30 laser pulses at each point to vaporize material from the rocks, resulting in brief, hot plasmas, which provide optical emissions. The atomic emission spectra are collected and calibrated to provide elemental compositions.
Target observation points and elemental abundances are provided in Table S3. Iron abundances are presented as FeO, noted as FeOT. Any LIBS footprint in the RMI that indicates a coating was observed was removed from our analysis. Compositions for all targets showing high aluminum oxide are given in this table. Points that are obscured by soil beyond shot 5 out of 30 were not included (normally the reported composition for a given point omits spectra from the first five of 30 shots due to dust contamination). This criterion excluded two points with high aluminum. One is Lake Clark point #2, which was either buried by deeper soil or excavated through a coating, or both. It also excludes Serpent Tongue Glacier (Sol 540), point #2, which showed high aluminum starting around shot #10, indicating a buried high-aluminum pebble or clast. It was never seen in the images. A search was made of all laser shots since the beginning of the mission (> 100k), and no other shots show high Al2O3 (e.g., > 20 wt%) that were not attributed to plagioclase feldspar. On the other hand, points on the high-aluminum rocks that hit a lower-aluminum component are included for context. The Finch Lake rock was originally targeted on Sol 774, but SuperCam missed the target. A small pebble just below the target was observed with one point and showed an Al2O3 abundance of 16.6 wt%. But since this was a distinct pebble, it was not included with Finch Lake in the table, and given that the aluminum is much lower than other rocks, it was not discussed in this paper. One target, Trayfoot Mountain (Sol 704), is included in this work because it clearly shows high aluminum in the LIBS spectra. However, since the target was > 10 m from SuperCam, at the edge of the LIBS capability range, the elemental abundances are not well quantified, and are not presented here.
Accuracies for the mean abundances from Table S3 are based on results shown in Fig. 24 of ref. 54, and are as follows: SiO2, TiO2, Al2O3, FeOT, MgO, CaO, Na2O, K2O: ± 5.5, 0.18, 3.0, 1.5, 0.5 0.5, 0.4, 0.5 wt%. These differ from Table 5 of ref. 54 because the mean abundances in these rocks are quite different from the means used for Table 5. Precisions are significantly better, generally similar to those given in Table 6 of ref. 54. One exception is that, due to the lack of standards used with high Al and low K, the elevated K derived in some of the results may be considered suspect.
More details about the calibration of the abundances of Ni, Mn and Cr are given in Supplementary Text S1
Chemical index of alteration
An estimate of the degree of open-system aqueous alteration of basaltic materials is provided by the chemical index of alteration (CIA;30). It is calculated as the mole fraction of aluminum oxides to total felsic cations as
| 1 |
where CaO* is the original igneous fraction of CaO not bound to S, C, or P. Here we use the total CaO abundance since these are all low. The results are found in Table S3. The bulk Martian crust has a CIA around 3732. Pure plagioclase has a CIA of 50, and values above 50 are generally considered to be evidence of alteration. Inspection of the data suggests the possibility of subsequent alteration by K-rich fluids, as has also been the case in some terrestrial laterites55.
As Jezero crater is in a more mafic region of Mars, it may be helpful to also consider the molar mafic index of alteration (MIA;55), which for oxidizing environments considers the retention of iron. And an index of laterization (IOL) has been used for highly altered rocks (e.g., Schellmann56 and references therein). The details of the calculations of MIA and IOL are given in Supplementary Text S2
IRS radiometric calibration
The radiometric calibration of SuperCam VISIR spectra is described in detail by Royer et al.15,57. SuperCam collects sunlight reflected from Martian rocks and soils through its telescope in the Mast Unit. This light is directed to its two separate spectrometer systems: Visible (VIS; 400 – 850 nm), and the Infrared Spectrometer (IRS; 1.3 – 2.6 mm)8,9,14. The light entering the spectrometers has a field of view (FOV) of 0.7 mrad for the VIS spectrometer and 1.15 mrad for the IRS9, corresponding to ~ 1.4 and ~ 2.3 mm footprint, respectively at 2.0 m distance. As such, several mineral phases can be present at this scale within a given FOV. Also, because the footprint center of the IRS is offset by 0.3 mrad with regard to the VIS spectra9, selection of raster locations intended to cover specific targets of interest may vary between the two spectral regions.
The infrared spectra were converted into reflectance using a semi-empirical instrumental model based on the reflectance of the onboard AluWhite calibration target58 and an 719 illumination model and solar ephemeris15. The reflectance spectra assume that the target is horizontal and Lambertian.
IR band depth and band depth-to-noise ratio calculation
The band depth (BD) was calculated using the calibrated reflectance R and the formalism described by Viviano et al.59. More precisely:
| 2 |
Where a and b are weighting coefficients corresponding to the relative distance between the band minimum and the shoulders, and the c, l and s subscripts correspond to the position of the band minimum (or center) and the short and long wavelength shoulders.
The uncertainty of the band depth is estimated using the uncertainties (σ) of the three points used to calculate it, i.e., the band minimum and its two shoulders, in reflectance. It is determined by considering the errors of these three points as independent, which is justified by the fact that the IRS acquires the spectral channels successively by changing the state of its AOTF filter. The band depth to noise ratio (BDNR) is then calculated by:
| 3 |
Reflectance and uncertainty are provided for each observation by the SuperCam Bundle on the NASA Planetary Data System60.
Detailed IR linear modeling method and limits
Overview of the linear modeling approach
Modeling of reflectance spectra is an analysis method that has been used during decades to study the surface of Mars, using a variety of different methodologies and wavelength ranges. It can be used to systematically analyze a large number of spectra, in order to construct compositional maps, in the case of spectral imagers, or to identify average trends in a dataset. Each method has its own specific features, advantages and limitations. Examples include the individual study of absorption bands with Tetracorder61,62, which fits absorption bands with a linear combination of pure mineral bands; or the Modified Gaussian Model algorithm63 adapted to the study of mafic mineral mixtures, notably on Mars64,65. Other methods seek to model the entire spectrum, with different approaches: the SMA (Spectral Mixing Analysis66,67) and MELSUM (Multiple-Endmember Linear Spectral Unmixing Model68–71) rely on the use of a linear combination of laboratory spectra or the dataset itself to deduce the composition of the observed sample, while more advanced radiative transfer models72–74 use the optical constants of the minerals as well as their grain size and the geometric parameters of the observation.
However, apart from the shape and position of absorption bands, composition is not solely responsible for the shape of reflectance spectra. Surface roughness, grain size, level of mixing (spatial or intimate), presence of inclusions, porosity and illumination and observation conditions are all parameters that play a role in the absolute reflectance level, the shape of the spectral continuum and the depth of absorption bands. A complete modeling of all these effects would require a knowledge of minerals beyond that currently available in databases (i.e., scattering coefficients, optical constants), but under certain hypotheses, the models described above make it possible to deduce a quantitative composition of the observed mixture. In the case of spatial mixtures, the scale of the mixture is greater than the mean free path of the photons, so they are scattered by a single mineral and the reflectance spectrum is the average of the spectra of each mineral weighted by the relative area covered by them in the field of view. A SMA or MELSUM-type description is suitable for these mixtures. On the other hand, intimate mixtures are such that photons are scattered by grains of different composition as they pass through the medium. If the medium is granular, then the radiative transfer models of Shkuratov and Hapke can be used to estimate grain sizes and relative mineral abundances. However, reality is more complex than these extreme cases, and these models often give degenerate results, i.e., the same spectrum can be modeled with comparable uncertainties by different sets of parameters.
In the case of our study, we have opted for a spatial description of IR spectra, but with a different, higher-level approach to that of MELSUM and SAM, which enables us to free ourselves from endmember representativeness bias to the detriment of accuracy in determining composition. The main strength of this technique is its ability to determine the mineral phases most likely to describe the data and, therefore, to be present in the mixture. Note, however, that, the values of the mixing coefficients (i.e., their weighted average) are intended to describe only the similarity of a given spectrum to a combination of selected laboratory spectra (endmembers) and are not linearly related to the abundances of those minerals in the rock. Moreover, the spectrum of a given mineral may vary with its grain size, porosity, concentration of impurities, and the inherent non uniqueness of linear spectral modeling makes it difficult to distinguish similar from each other. Thus, the minerals selected were grouped into families to compensate for those differences (see Table S4). All the laboratory spectra used in spectral modeling are listed in Table S5. The relevance of the spectral library is discussed in Supplementary Text S3.
General principles, advantages and limitations
Unlike the MELSUM method, we have chosen not to limit the endmembers of the simulated mixture to a small number (4 in the typical use case of MELSUM), but to use a large number ( ~200), more representative of the diversity of mineral spectra.
As explained above, linear modeling is suitable for samples with large mixing scales, but this is not necessarily the case for the SuperCam observations studied here, whose millimeter-scale fields of view are sometimes made up of fine, heterogeneous grains on a sub-millimeter scale. Similarly, spectra from laboratory databases are also measured as powders, grain separates or cut surfaces (unlike Martian surfaces) and can contain impurities (other co-occurring phases). A spectrum of a given mineral is generally representative of the presence of that same mineral in the rock studied, but this is not systematic. This is why our approach uses a large number of laboratory spectra, taking into account the diversity of noncompositional effects. Our method is therefore not quantitative but allows us to test the plausibility of a mixture of minerals by looking for the species most likely to describe the data. Moreover, some endmembers do not have diagnostic absorption bands enabling clear identification, but their presence is necessary to explain the observed band depth ratios, band shapes, and/or spectral slopes. Finally, some mineral species have rather similar spectra such that the spectral sampling of the IRS data and the precision of our data and processing methods make it impossible to discriminate them. For this reason, we have chosen to group the results into mineral families, combining the mixing coefficients of several similar mineral species whose general properties can be identified with greater certainty. Only species showing absorption features are thus modeled, featureless ones, such as plagioclase for example, being undetectable or masked by photometric effects.
Linear mixture models were found to be less well constrained with the visible wavelength spectra, likely owing to a combination of residual calibration uncertainties between detector regions (Fig. S6) and greater nonlinear mixing effects in this wavelength region resulting from variations in grain size and/or mixtures of more opaque and transparent materials. However, the candidate minerals identified from the near-infrared linear mixture modeling results (Table S4) provided qualitative constraints on possible mineral combinations necessary to explain the main features in visible spectra. For example, the monotonic positive slopes associated with Class 1 are consistent with combinations of kaolinite, kieserite, and chromite, whereas the distinctive Class 2 spectra likely represent contributions from cordierite and ferrihydrite. The less distinctive Class 3 spectra are more influenced by a combination of spinels with clay minerals.
IR modeling method
Linear modeling of the data is based on a Bayesian method of searching for the parameters of the mixing model, followed by statistical analysis of the results using a Markov Chain Monte Carlo (MCMC) algorithm. Only the IR part, from 1.3 to 2.6 μm, is modeled in this way, because at shorter wavelengths (i.e., 0.40–0.85 μm) the nonlinear effects of opaque phases and mixtures increases the uncertainties of modeled mixing coefficients, in addition to possible coregistration effects between the two optical paths.
The modeling steps are as follows:
Normalization of spectra: since the absolute value of the continuum depends on other parameters in addition to composition, all spectra (both experimental and laboratory) are normalized by division by their mean value.
Selection of the library of endmembers participating in the mixture: endmembers are selected from mineral families whose spectral signatures have been suggested by manual comparisons of the spectra to laboratory databases (e.g., with the 2.2 μm feature in Fig. S13), and whose composition is compatible with the results of chemical analysis of LIBS. This is therefore not an unsupervised approach. Within each mineral family, species were selected for their spectral signatures and to represent the diversity of measurement conditions (sample state, grain size, observation geometry) and sample purity (presence of other minor species, more or less adsorbed hydration). Selected minerals are then tested to check whether they improve the quality of the fit (see Supplementary Text S3 and Figs. S14 to S16). In all, nearly 200 endmembers in 10 mineral families were selected. To partially account for photometric effects not modeled by the linear approach, three artificial spectral components were added to the mineral endmembers: a dark continuum, constant at 0.1, to adjust for the contrast of absorption bands due to the presence of phases without spectral signatures, and two continua with positive and negative slopes (simply straight lines between 0 and 0.1 over the spectral range) to attempt to compensate for dust scattering effects. The use of these artificial endmembers is explained, for example, in69,70.
Determination of mixing coefficients for each observation. This is a Basyesian approach in which the aim is to maximize a likelihood function, defined as the exponential of the root mean square between the model and the data. The coefficients are randomly drawn according to a uniform distribution.
Selection of endmembers whose mixing coefficient is greater than 0.01. Coefficients whose value is too low (< 1%) do not correspond to significantly present endmembers and are ignored for the rest of the process. The resulting modeled spectrum using those coefficients on each target is given in Fig. S8.
Statistical analysis using the MCMC method. The endmembers selected in the previous step are re-injected into an MCMC sampler to calculate the posterior distributions of each of the mixture parameters. The median of these distributions corresponds to the maximum likelihood, and their width gives the sensitivity of the mixture to the presence of each endmember. Thus, a quality criterion is defined as the ratio of the median value by the width of the distribution. A value lower than 1.5 means that the endmember does not affect significantly the quality of the fit (Fig. S9).
Open research: All data are available in the main text, the supplementary materials, on the NASA Planetary Data System SuperCam Bundle and on a public repository hosted by Zenodo (10.5281/zenodo.13918367).
Supplementary information
Acknowledgements
NASA contract NNH13ZDA018O for SuperCam (CR, CCB, RCW, AO, SC); SuperCam (1532432), Mastcam-Z (15-707, 1511125) (JRJ); Mastcam-Z (15-707, 1511125) (BK); Texaco Postdoctoral prize fellowship awarded by the division of Geological and Planetary Sciences of Caltech (LM); Spanish Agency for Research AEI/MCIN/FEDER, Grant No. PID2022-142750OB-I00 (JMM); NASA RSS PS grant 80NSSC20K0239 (EMH)
Author contributions
C.Royer: investigation, methodology, visualisation, supervision, writing-original draft, writing-review. C.C.Bedford: investigation, methodology, visualisation, supervision, writing-original draft, writing-review. J. R. Johnson: investigation, methodology, visualisation, writing-original draft, writing-review. B.H.N. Horgan: investigation, writing-original draft, writing-review. A.Broz: investigation, visualisation, writing-original draft, writing-review. O.Forni: investigation, methodology, visualisation. S.Connell: investigation, methodology, visualisation. R.C.Wiens: investigation, methodology, supervision, writing-original draft, writing-review. L.Mandon: investigation, writing-review. B.S.Kathir: investigation, visualisation. E.M.Hausrath: investigation, writing-review. A. Udry: investigation, writing-review. J.M.Madariaga: investigation, methodology, writing-original draft, writing-review. E.Dehouck: investigation, writing-review. R.B.Anderson: investigation, methodology. P.Beck: investigation, writing-review. O.Beyssac: investigation. É.Clavé: investigation, writing-review. S.M.Clegg: investigation. E.Cloutis: investigation. T.Fouchet: investigation. T.S.J.Gabriel: investigation, methodology. B.J.Garczynski: investigation. A.Klidaras: investigation. H.T.Manelski: investigation. L.Mayhew: investigation. J.Núñez: investigation. A.M.Ollila: investigation. S.Schröder: investigation. J.I.Simon: investigation. U.Wolf: investigation. K.M.Stack: investigation. A.Cousin: investigation. S.Maurice: investigation.
Peer review
Peer review information
Communications Earth & Environment thanks Benjamin Tutolo, John Mustard for their contribution to the peer review of this work. Primary Handling Editors: Joe Aslin. A peer review file is available.
Competing interests
The authors declare no competing interests. C. Bedford is an Editorial Board Member for Communications Earth & Environment, but was not involved in the editorial review of, nor the decision to publish this article.
Footnotes
Publisher’s note Springer Nature remains neutral with regard to jurisdictional claims in published maps and institutional affiliations.
These authors contributed equally: C. Royer, C. C. Bedford.
Supplementary information
The online version contains supplementary material available at 10.1038/s43247-024-01837-2.
References
- 1.Hubbard, G. S., Naderi, F. M. & Garvin, J. B. Following the water, the new program for Mars exploration. Acta Astronaut.51, 337–350 (2002). [DOI] [PubMed] [Google Scholar]
- 2.Fassett, C. I. & Head, J. W. The timing of martian valley network activity: Constraints from buffered crater counting. Icarus195, 61–89 (2008). [Google Scholar]
- 3.Farley, K. A. et al. Mars 2020 Mission Overview. Space Sci. Rev.216, 142 (2020). [Google Scholar]
- 4.Goudge, T. A., Mustard, J. F., Head, J. W., Fassett, C. I. & Wiseman, S. M. Assessing the mineralogy of the watershed and fan deposits of the Jezero crater paleolake system, Mars. J. Geophys. Res.: Planets120, 775–808 (2015). [Google Scholar]
- 5.Stack, K. M. et al. Photogeologic Map of the Perseverance Rover Field Site in Jezero Crater Constructed by the Mars 2020 Science Team. Space Sci. Rev.216, 127 (2020). [DOI] [PMC free article] [PubMed] [Google Scholar]
- 6.Scheller, E. L. & Ehlmann, B. L. Composition, Stratigraphy, and Geological History of the Noachian Basement Surrounding the Isidis Impact Basin. J. Geophys. Res.: Planets125, e2019JE006190 (2020). [DOI] [PMC free article] [PubMed] [Google Scholar]
- 7.Garczynski, B. J. et al. Perseverance and the Purple Coating: A Mastcam-Z Multispectral Story. 2678, 2346 (2022).
- 8.Wiens, R. C. et al. SuperCam on the Perseverance Rover for Exploration of Jezero Crater: Remote LIBS, VISIR, Raman, and Time-Resolved Luminescence Spectroscopies Plus Micro-Imaging and Acoustics. LPI Contribut.52, 2 (2021). [Google Scholar]
- 9.Maurice, S. et al. The SuperCam Instrument Suite on the Mars 2020 Rover: Science Objectives and Mast-Unit Description. Space Sci. Rev.217, 47 (2021). [DOI] [PMC free article] [PubMed] [Google Scholar]
- 10.Wiens, R. C. et al. Compositionally and density stratified igneous terrain in Jezero crater, Mars. Sci. Adv.8, eabo3399 (2022). [DOI] [PMC free article] [PubMed] [Google Scholar]
- 11.Udry, A. et al. A Mars 2020 Perseverance SuperCam Perspective on the Igneous Nature of the Máaz Formation at Jezero Crater and Link With Séítah, Mars. J. Geophys. Res.: Planets128, e2022JE007440 (2023). [Google Scholar]
- 12.Beyssac, O. et al. Petrological traverse of the olivine cumulate Séítah formation at Jezero crater, Mars : A perspective from SuperCam onboard Perseverance. J. Geophys. Res.: Planetsn/a, e2022JE007638 (2023). [Google Scholar]
- 13.Clark, R. N., King, T. V. V., Klejwa, M., Swayze, G. A. & Vergo, N. High spectral resolution reflectance spectroscopy of minerals. J. Geophys. Res.: Solid Earth95, 12653–12680 (1990). [Google Scholar]
- 14.Fouchet, T. et al. The SuperCam infrared spectrometer for the perseverance rover of the Mars2020 mission. Icarus373, 114773 (2022). [Google Scholar]
- 15.Royer, C. et al. Reflectance of Jezero Crater Floor: 1. Data Processing and Calibration of the Infrared Spectrometer (IRS) on SuperCam. J. Geophys. Res.: Planets.128 (2023).
- 16.Mandon, L. et al. Reflectance of Jezero Crater Floor: 2. Mineralogical Interpretation. J. Geophys. Res.: Planets128, e2022JE007450 (2023). [Google Scholar]
- 17.Bishop, J. L. et al. Mineralogy of Layered Outcrops at Mawrth Vallis and Implications for Early Aqueous Geochemistry on Mars 1332 (2016).
- 18.Friedlander, L. R. et al. Structural and spectroscopic changes to natural nontronite induced by experimental impacts between 10 and 40 GPa. J. Geophys. Res.: Planets120, 888–912 (2015). [Google Scholar]
- 19.Michalski, J. R. et al. Shock metamorphism of clay minerals on Mars by meteor impact. Geophys. Res. Lett.44, 6562–6569 (2017). [Google Scholar]
- 20.Cloutis, E. A., Sunshine, J. M. & Morris, R. V. Spectral reflectance-compositional properties of spinels and chromites: Implications for planetary remote sensing and geothermometry. Meteorit. Planet. Sci.39, 545–565 (2004). [Google Scholar]
- 21.Clark, B. C. et al. Evidence for montmorillonite or its compositional equivalent in Columbia Hills, Mars. J. Geophys. Res.: Planets.112 (2007).
- 22.Carter, J., Loizeau, D., Mangold, N., Poulet, F. & Bibring, J.-P. Widespread surface weathering on early Mars: A case for a warmer and wetter climate. Icarus248, 373–382 (2015). [Google Scholar]
- 23.Gaudin, A., Dehouck, E. & Mangold, N. Evidence for weathering on early Mars from a comparison with terrestrial weathering profiles. Icarus216, 257–268 (2011). [Google Scholar]
- 24.Liu, J. et al. Anoxic chemical weathering under a reducing greenhouse on early Mars. Nat. Astron.5, 503–509 (2021). [Google Scholar]
- 25.Loizeau, D. et al. Stratigraphy in the Mawrth Vallis region through OMEGA, HRSC color imagery and DTM. Icarus205, 396–418 (2010). [Google Scholar]
- 26.Ehlmann, B. L. et al. Identification of hydrated silicate minerals on Mars using MRO-CRISM: Geologic context near Nili Fossae and implications for aqueous alteration. J. Geophys. Res. (Planets)114, E00D08 (2009). [Google Scholar]
- 27.Broz, A. P. et al. Mineralogy and diagenesis of Mars-analog paleosols from eastern Oregon, USA. Icarus380, 114965 (2022). [Google Scholar]
- 28.Ye, B. & Michalski, J. R. Chemical weathering over hundreds of millions of years of greenhouse conditions on Mars. Commun. Earth Environ.3, 1–14 (2022). [Google Scholar]
- 29.Taylor, S. R. & McLennan, S.Planetary Crusts: Their Composition, Origin and Evolution. Cambridge Planetary Science (Cambridge University Press, Cambridge, 2008).
- 30.Nesbitt, H. W. & Young, G. M. Early Proterozoic climates and plate motions inferred from major element chemistry of lutites. Nature299, 715–717 (1982). [Google Scholar]
- 31.Mangold, N. et al. Chemical alteration of fine-grained sedimentary rocks at Gale crater. Icarus321, 619–631 (2019). [Google Scholar]
- 32.Dehouck, E. et al. Overview of the Bedrock Geochemistry and Mineralogy Observed by SuperCam During Perseverance’s Delta Front Campaign. Lunar Planet. Sci. Contrib.2806, 2862 (2023). [Google Scholar]
- 33.Marsh, E. E., Anderson, E. D. & Gray, F. Nickel-cobalt laterites: A deposit model. USGS Numbered Series 2010-5070-H, U.S. Geological Survey, Reston, VA (2013).
- 34.Nahon, D. B., Boulangé, B. & Colin, F. Chapter 17 - Metallogeny of weathering: An introduction. In Martini, I. P. & Chesworth, W. (eds.) Developments in Earth Surface Processes, vol. 2 of Weathering, Soils & Paleosols, 445–471 (Elsevier, 1992).
- 35.Lowe, D. R., Bishop, J. L., Loizeau, D., Wray, J. J. & Beyer, R. A. Deposition of >3.7 Ga clay-rich strata of the Mawrth Vallis Group, Mars, in lacustrine, alluvial, and aeolian environments. GSA Bull.132, 17–30 (2019). [DOI] [PMC free article] [PubMed] [Google Scholar]
- 36.Ehlmann, B. L. et al. Subsurface water and clay mineral formation during the early history of Mars. Nature479, 53–60 (2011). [DOI] [PubMed] [Google Scholar]
- 37.Niles, P. B. & Michalski, J. Meridiani Planum sediments on Mars formed through weathering in massive ice deposits. Nat. Geosci.2, 215–220 (2009). [Google Scholar]
- 38.Bishop, J. L. et al. Surface clay formation during short-term warmer and wetter conditions on a largely cold ancient Mars. Nat. Astron.2, 206–213 (2018). [DOI] [PMC free article] [PubMed] [Google Scholar]
- 39.Deer, W. A., Howie, R. A. & Zussman, J.An Introduction to the Rock-Forming Minerals (Mineralogical Society of Great Britain and Ireland, 2013).
- 40.Barnes, S. J. & Roeder, P. L. The Range of Spinel Compositions in Terrestrial Mafic and Ultramafic Rocks. J. Petrol.42, 2279–2302 (2001). [Google Scholar]
- 41.Barkov, A. Y., Nixon, G. T., Levson, V. M., Martin, R. F. & Fleet, M. E. Chromian Spinel From PGE-bearing Placer Deposits, British Columbia, Canada: Mineralogical Associations And Provenance. Can. Mineralog.51, 501–536 (2013). [Google Scholar]
- 42.Pownceby, M. & Bourne, P. Detrital chrome-spinel grains in heavy-mineral sand deposits from southeast Africa. Mineralog. Mag.70, 51–64 (2006). [Google Scholar]
- 43.Lumpkin, G. R. Crystal chemistry and durability of the spinel structure type in natural systems. Prog. Nucl. Energy38, 447–454 (2001). [Google Scholar]
- 44.Tice, M. M. et al. Regional Paleoenvironments Recorded in Sedimentary Rocks of the Western Fan-Delta, Jezero Crater, Mars. 55th Lunar and Planetary Science Conference2181 (2024).
- 45.Dasgupta, S. & Sengupta, P. Ultrametamorphism in Precambrian granulite terranes: Evidence from Mg-AI granulites and calc-silicate granulites of the Eastern Ghats, India. Geol. J.30, 307–318 (1995). [Google Scholar]
- 46.Del Moro, S., Renzulli, A. & Tribaudino, M. Pyrometamorphic Processes at the Magma–Hydrothermal System Interface of Active Volcanoes: Evidence from Buchite Ejecta of Stromboli (Aeolian Islands, Italy). J. Petrol.52, 541–564 (2011). [Google Scholar]
- 47.Lanson, B. et al. Authigenic kaolin and illitic minerals during burial diagenesis of sandstones: A review. Clay Miner.37, 1–22 (2002). [Google Scholar]
- 48.Platov, Yu. T., Platova, R. A. & Molodkina, P. G. Using Decomposition of IR Spectra to Analyze Structural-Phase Transformations of Kaolinite. J. Appl. Spectrosc.87, 1029–1036 (2021). [Google Scholar]
- 49.Chauffeton, C. & Wallez, G. Crystal-chemical investigation of the “cubic Al–Si spinel” issued from the thermal transformation of kaolinite and halloysite. J. Am. Ceram. Soc.105, 4986–4993 (2022). [Google Scholar]
- 50.Hwang, H. et al. A role for subducted super-hydrated kaolinite in Earth’s deep water cycle. Nat. Geosci.10, 947–953 (2017). [Google Scholar]
- 51.Hahn, B. C., McSween, H. Y. & Tosca, N. J. Constraints on the Stabilities of Observed Martian Secondary Mineral Phases from Geothermal Gradient Models 2340 (2011).
- 52.Werner, S. C. The early martian evolution—Constraints from basin formation ages. Icarus195, 45–60 (2008). [Google Scholar]
- 53.Ehlmann, B. L. & Mustard, J. F. An in-situ record of major environmental transitions on early Mars at Northeast Syrtis Major. Geophys Res Lett.39 (2012).
- 54.Anderson, R. B. et al. Post-landing major element quantification using SuperCam laser induced breakdown spectroscopy. Spectrochim. Acta Part B: At. Spectrosc.188, 106347 (2022). [Google Scholar]
- 55.Babechuk, M. G., Widdowson, M. & Kamber, B. S. Quantifying chemical weathering intensity and trace element release from two contrasting basalt profiles, Deccan Traps, India. Chem. Geol.363, 56–75 (2014). [Google Scholar]
- 56.Schellmann, W. Geochemical differentiation in laterite and bauxite formation. CATENA21, 131–143 (1994). [Google Scholar]
- 57.Royer, C. et al. Pre-launch radiometric calibration of the infrared spectrometer onboard SuperCam for the Mars2020 rover. Rev. Sci. Instrum.91, 063105 (2020). [DOI] [PubMed] [Google Scholar]
- 58.Manrique, J. A. et al. SuperCam Calibration Targets: Design and Development. Space Sci. Rev.216, 138 (2020). [DOI] [PMC free article] [PubMed] [Google Scholar]
- 59.Viviano, C. E. et al. Revised CRISM spectral parameters and summary products based on the currently detected mineral diversity on Mars. J. Geophys. Res.: Planets119, 1403–1431 (2014). [Google Scholar]
- 60.Maurice, S. A. & Wiens, R. C. Mars 2020 SuperCam Bundle (2021).
- 61.Clark, R. N. et al. Imaging spectroscopy: Earth and planetary remote sensing with the USGS Tetracorder and expert systems: Imaging Spectroscopy Remote Sensing. J. Geophys. Res.: Planets.108 (2003).
- 62.Dalton, J. B. et al. Searching for Aqueous Mineralogy on Mars Utilizing a Surface Water Flow Model, Mars Global Surveyor and Mars Odyssey Data2003, P21B–0052 (2003).
- 63.Sunshine, J. M., Pieters, C. M. & Pratt, S. F. Deconvolution of mineral absorption bands: An improved approach. J. Geophys. Res.: Solid Earth95, 6955–6966 (1990). [Google Scholar]
- 64.Bibring, J.-P. et al. Mars Surface Diversity as Revealed by the OMEGA/Mars Express Observations. Science307, 1576 (2005). [DOI] [PubMed] [Google Scholar]
- 65.Mustard, J. F. et al. Olivine and Pyroxene Diversity in the Crust of Mars. Science307, 1594–1597 (2005). [DOI] [PubMed] [Google Scholar]
- 66.Adams, J. B., Smith, M. O. & Johnson, P. E. Spectral mixture modeling: A new analysis of rock and soil types at the Viking Lander 1 Site. J. Geophys. Res.: Solid Earth91, 8098–8112 (1986). [Google Scholar]
- 67.Merényi, E., Singer, R. B. & Miller, J. S. Mapping of Spectral Variations on the Surface of Mars from High Spectral Resolution Telescopic Images. Icarus124, 280–295 (1996). [Google Scholar]
- 68.Roberts, D. A. et al. Mapping Chaparral in the Santa Monica Mountains Using Multiple Endmember Spectral Mixture Models. Remote Sens. Environ.65, 267–279 (1998). [Google Scholar]
- 69.Combe, J. P. et al. Analysis of OMEGA/Mars Express data hyperspectral data using a Multiple-Endmember Linear Spectral Unmixing Model (MELSUM): Methodology and first results. Planet. Space Sci.56, 951–975 (2008). [Google Scholar]
- 70.Le Mouelic, S. et al. An iterative least squares approach to decorrelate minerals and ices contributions in hyperspectral images: Application to Cuprite (earth) and Mars. In 2009 First Workshop on Hyperspectral Image and Signal Processing: Evolution in Remote Sensing, 1–4 (2009).
- 71.Johnson, J. R. et al. Mineralogic constraints on sulfur-rich soils from Pancam spectra at Gusev crater, Mars. Geophys. Res. Lett.34 (2007).
- 72.Hapke, B. Bidirectional Reflectance Spectroscopy: 1. Theory. J. Geophys. Res.: Solid Earth86, 3039–3054 (1981). [Google Scholar]
- 73.Hapke, B.Theory of Reflectance and Emittance Spectroscopy (Cambridge University Press, 1993).
- 74.Shkuratov, Y., Starukhina, L., Hoffmann, H. & Arnold, G. A Model of Spectral Albedo of Particulate Surfaces: Implications for Optical Properties of the Moon. Icarus137, 235–246 (1999). [Google Scholar]
- 75.Bedford, C. C. et al. Alteration trends and geochemical source region characteristics preserved in the fluviolacustrine sedimentary record of Gale crater, Mars. Geochim. et. Cosmochim. Acta246, 234–266 (2019). [Google Scholar]
Associated Data
This section collects any data citations, data availability statements, or supplementary materials included in this article.