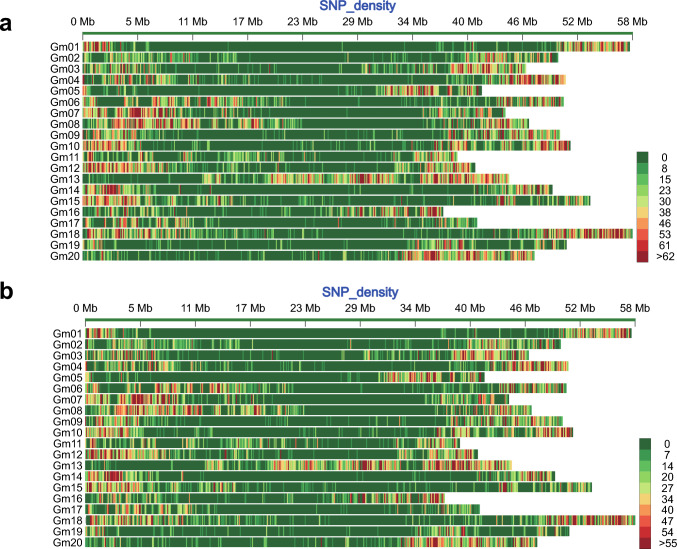
Fig. 4.
The single-nucleotide polymorphism (SNP) density between the high-multifoliolate frequency bulk (MUL) and the low-multifoliolate frequency bulk (TRI) on the soybean chromosomes. (a) Distribution of the SNPs between V0-MUL and V0-TRI. (b) Distribution of the SNPs between V1-MUL and V1-TRI. The color of each bar represents the number of SNPs within a 100-kbp window based on the color key. The horizontal axis represents the length of the chromosomes. V0, shoot apical bud from the true leaf stage and V1, leaf tissue from the first compound leaf

