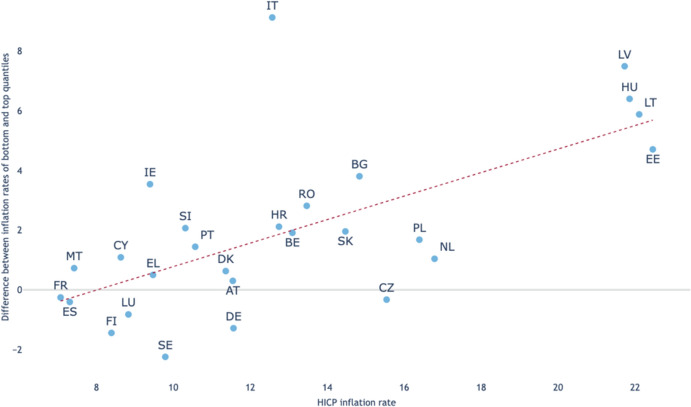
Fig. 9.
Inflation rates and inflation inequality—EU 27 (2022).
The graph was created by the Bruegel Institute using data from Eurostat and national statistical institutes. The data refers to October 2022. The Y-axis represents an indicator of the perceived inflation differential between the bottom and top quintiles of the income distribution. The X-axis depicts the inflation rate. Specifically, the acronym HICP stands for the Harmonized Index of Consumer Prices—an index used to measure inflation consistently when considering different countries

