. 2024 Oct 31;13(4):359–369. doi: 10.7774/cevr.2024.13.4.359

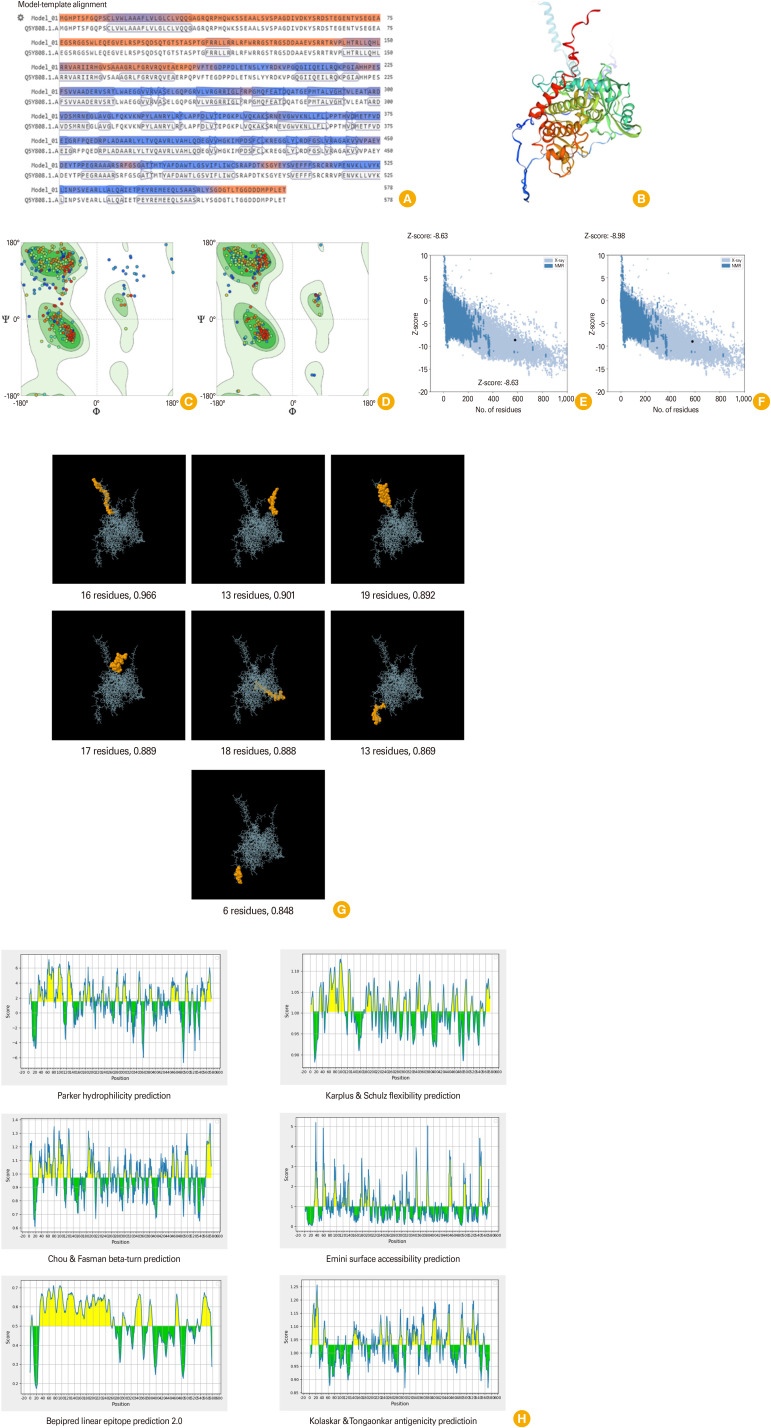
Fig. 2. (A) Model-template alignment and (B) three-dimensional (3D) model structure predicted for TgROP4 protein, provided by SWISS-MODEL server. (C–F) Validation of the 3D model of the TgROP4 protein via structure assessment tool and ProSA-web. Following analysis, the structure assessment tool of the SWISS-MODEL generated Ramachandran plots. It estimated that 88.72% and 98.09% of residues were located in favored regions prior to (C) and post-refinement (D), respectively. Based on the ProSA-web server, Z-score was determined to be –8.63 and –8.98 in the crude (E) and refined (F) 3D models, respectively, indicating that the 3D structure’s quality was enhanced post-refinement procedure. NMR, nuclear magnetic resonance. (G) Seven conformational B-cell epitopes on TgROP4 protein predicted by ElliPro. The white rods and orange domains show the TgROP4 protein and discontinuous B-cell epitopes, respectively. (H) The results of the IEDB online server were visualized for six variables, including hydrophilicity (average: 1.526), beta-turn (average: 0.970), Bepipred linear epitope 2.0 (average: 0.530), flexibility (average: 1.003), surface accessibility (average: 1.000), and antigenicity (average: 1.031). The x-axes represent the residue positions in the sequence, while the y-axes represent the corresponding score for each residue; the yellow color represents that the residue might have a greater probability of being a part of the epitope, and the green color represents the unfavorable regions relevant to the properties of interest.

Fig. 2