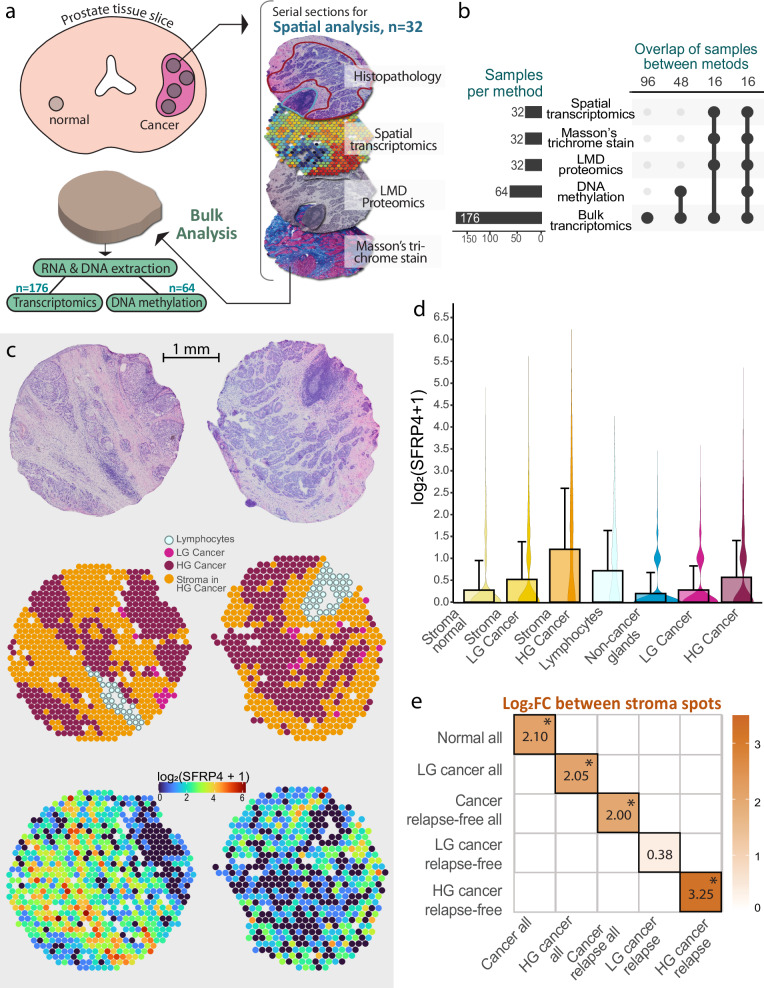
Fig. 1. Spatial transcriptomics and multiomics analysis of SFRP4.
a Workflow for collection of prostate cancer samples and multiomics analysis, which included both spatially resolved and bulk methodologies. b Overview of number of samples with different omics data and the overlap of samples between the different methodologies. c Spatial transcriptomics visualization of the two samples with the highest SFRP4 expression, showing H&E image, histology classifications and SFRP4 expression levels. d Bar plot of average gene counts (error bars show standard deviation) along with corresponding violin plots demonstrating the SFRP4 expression levels across the different histology groups in the whole dataset (n = 19 854 spots). e Diagram showing log2 fold change (log2FC) after differential analysis with edgeR comparing stroma spots of aggressive groups (x-axis) to the less aggressive group (y-axis). Values illustrated in (a, b) are given as log2(count+1). LMD laser microdissection, HG high-grade, LG low-grade.

