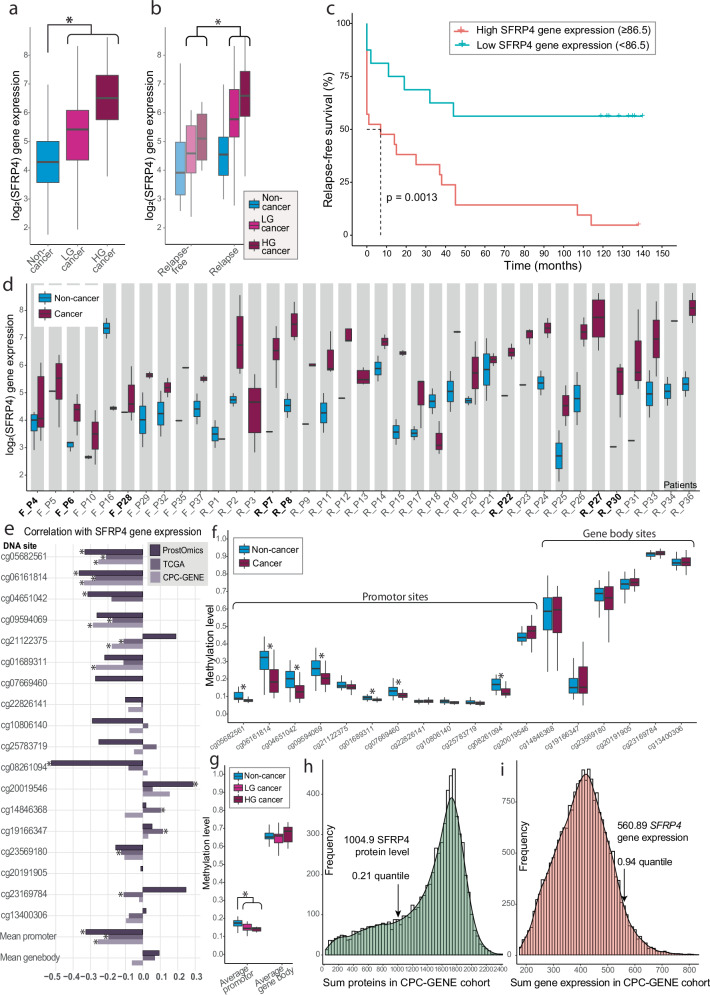
Fig. 2. Multiomics results of SFRP4.
Bulk transcriptomics; a Log2-transformed SFRP4 gene expression was elevated from non-cancer (n = 61) to low-grade (LG) cancer (n = 61) and further in high-grade (HG) cancer samples (n = 54). b SFRP4 gene expression levels were also higher in cancer samples from relapse patients compared to relapse-free patients. c Kaplan–Meier plot revealed SFRP4 to be significantly associated with time to relapse for the 37 patients. The SFRP4 cutoff value was determined by using the Cutoff Finder tool67. d SFRP4 gene expression levels across all patients (n = 37). The ‘R’ and ‘F’ in front of the patient ID represent relapse (N = 27) and relapse-free patients (N = 10), respectively, while the patients where ST data are available are marked with bold text. DNA methylomics; e DNA promotor sites were significantly correlated with SFRP4 gene expression across our cohort (ProstOmics, n = 64 samples) and the publicly available datasets TCGA-PRAD (The Cancer Genome Atlas Prostate Adenocarcinoma, n = 532) and CPC-GENE (The Canadian Prostate Cancer Genome Project n = 210). The SFRP4 gene promotor was significantly hypomethylated in cancer (n = 35) compared to non-cancer samples (n = 29) as shown across (f) all 18 methylation sites and (g) mean of promotor and gene body sites. Proteomics; Histogram of (h) summed protein and (i) gene expression levels in the publicly available CPC-GENE cohort show a higher SFRP4 mRNA level than SFRP4 protein relative to their respective datasets. The summed total and quantile levels of SFRP4 protein and gene expression levels are marked. Significance (p < 0.05) is symbolized with *.

