
Figure 3.
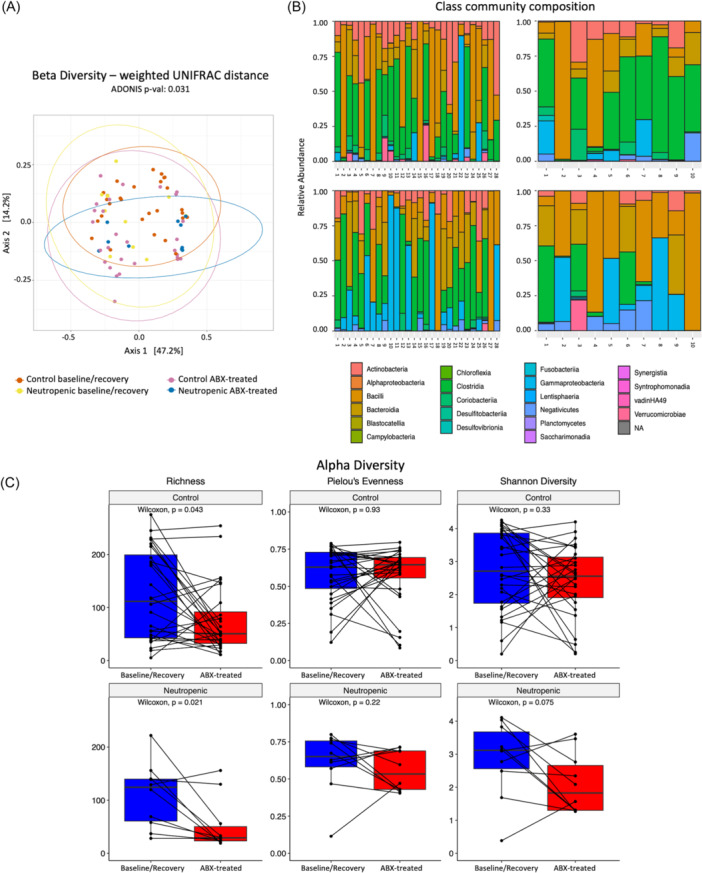
Neutropenic subjects have reduced stool microbiome diversity and decreased predominance of Lachnospiraceae by 16S sequencing. (A) Beta diversity assessed by weighted UNIFRAC distance. (B) Class community composition by groups (control on the left, neutropenic on the right) at baseline/recovery timepoint (top) and with antibiotic treatment (bottom). (C) Alpha diversity, assessed by richness, Pielou's Evenness, and Shannon diversity. Statistical significance is defined by p < 0.05 as determined by the Adonis test for beta‐diversity, and p < 0.05 determined by the Wilcoxon test for alpha‐diversity analysis (n = 10 neutropenic, 28 controls).