Figure 5.

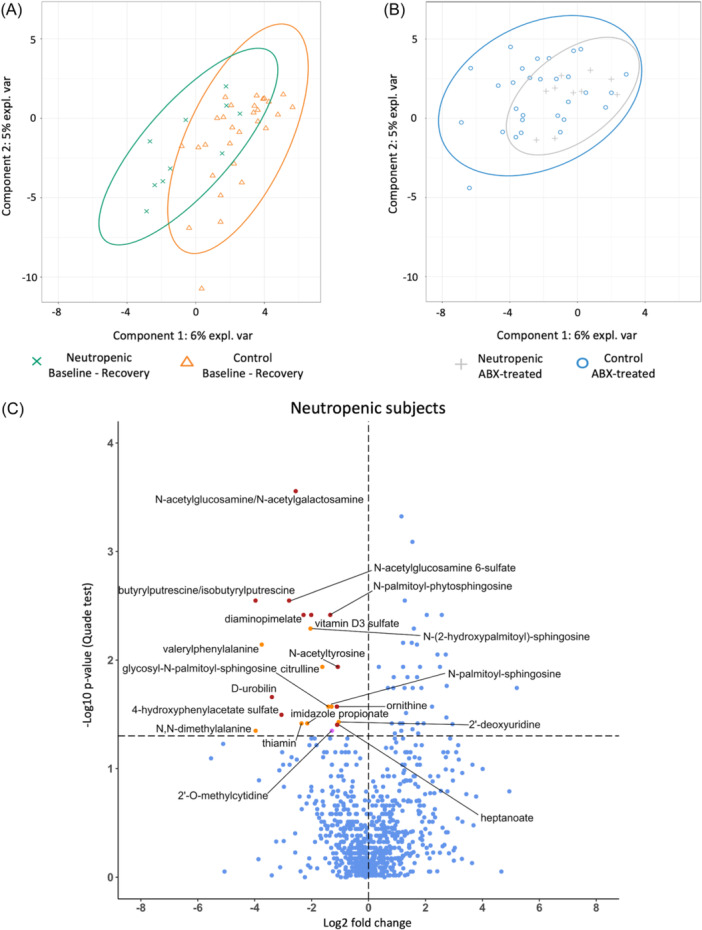
Twenty stool metabolites were depleted after antibiotic treatment in neutropenic subjects but not in controls. Stool samples were assessed by untargeted metabolomic analysis (A, B). sPLS‐DA analysis shows that metabolomes between groups generally overlap between groups at baseline (and/or recovery) (A) and during (B) antibiotic treatment. (C) Volcano plot with annotations shows the twenty‐one metabolites that were significantly depleted with antibiotic treatment in neutropenic but not control subjects (orange dots represent metabolites that contribute to sPLS‐DA Component One, purple dot for Component Two; remainder of metabolites shown with red dots). Horizontal dotted line indicates p = 0.05, statistical significance is defined as p < 0.05 determined by Quade test. (n = 10 neutropenic, 29 controls).
