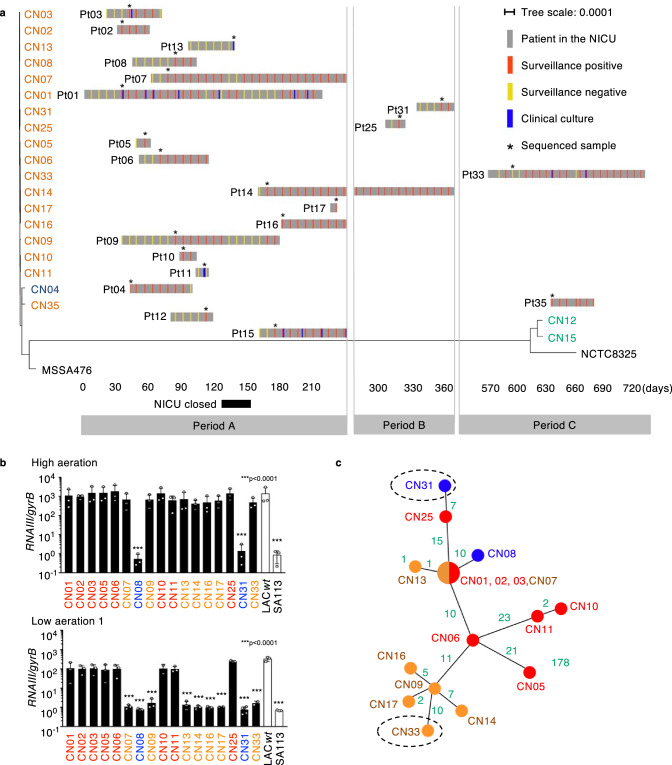
Fig. 1. Characterization of the MRSA lineage causing an infection outbreak at NICU.
a Timeline of the MRSA outbreak in the NICU layered with a maximum-likelihood phylogenetic tree based on the core genome SNVs. We screened all infants in the NICU for MRSA carriage in feces and throat weekly (surveillance). Some patients experienced MRSA infections (clinical culture). The sampled isolates used for analysis (*) were named CN01 to CN33, corresponding to the patient (Pt) number. Isolates are color-coded as ST1 (CC1): orange, ST2764: blue, and ST8 (CC8): green. MSSA476 (ST1) and NCTC8325 (ST8) were used as reference strains. b Normalized RNAIII expression in 4-hour cultures of MRSA outbreak lineage (CN01agr+-CN03 agr+, CN05agr+, CN06agr+, CN07EA, CN08agr–, CN09 EA, CN10agr+, CN11agr+, CN13EA, CN14EA, CN16EA, CN17EA, CN18agr–and CN33EA) under high or low aeration (n = 3, biological measurements). LAC wt and SA113 strains are shown as positive and negative controls. Data are presented as mean values +/− SEM. ***p < 0.0001, Kruskal-Wallis test with two-tailed Dunn’s post-hoc test. The dots represent the number (n) of biological measurements. c An unrooted maximum-likelihood phylogenetic tree based on the core genome SNVs of the outbreak lineage (ST1-SCCmecIV-agrIII). Green: SNV number between each isolate. Dotted circles: isolates in the late period of the study (>day 365). SNV Single nucleotide variation. b, c Red color: Agr positive subclones, Blue color: agr mutant subclones, Orange color: EA-Agr subclones.

