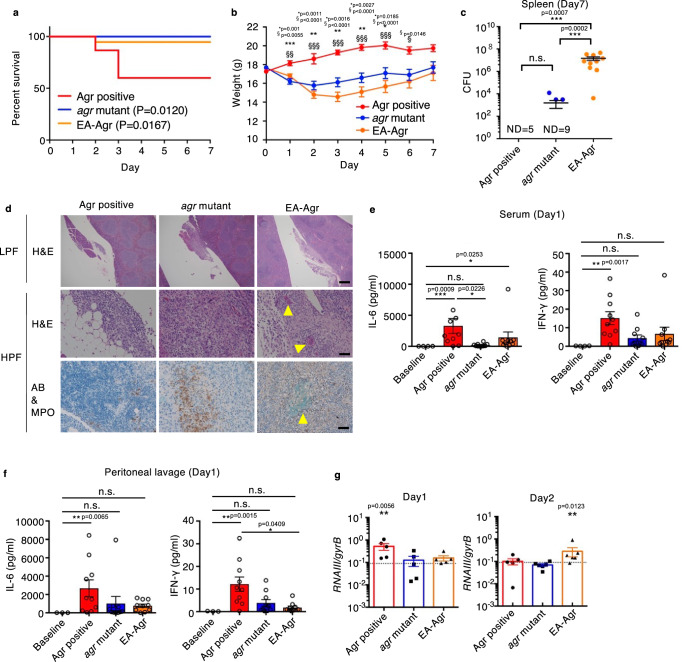
Fig. 3. EA-Agr bacteria exhibit reduced pathogenicity, but increased ability to colonize hosts.
a Survival rate and (b) body weight up to 7 days after C57BL/6 mice were intraperitoneally inoculated with Agr positive (CN02agr+), agr mutant (CN08agr–), or EA-Agr (CN17EA). The survival curve comparison was analyzed by two-tailed Gehan-Breslow-Wilcoxon test (CN02agr+: n = 15, CN08agr–: n = 13, CN17EA: n = 19). For each time point, a significant difference is represented as: * between Agr positive and agr mutant, and § between Agr positive and EA-Agr (CN02agr+: n = 8, CN08agr–: n = 12, CN17EA: n = 11). One-way ANOVA with Tukey’s multiple comparisons test. c Bacterial loads in the spleen at 7 days after bacterial inoculation. ND not detected. d Histological analysis of pancreaticosplenic ligament. LPF low power field, HPF high power field, H&E hematoxylin and eosin, AB alcian-blue, MPO myeloperoxidase. Scale bar; 500 µm (LPF), 100 µm (HPF). Yellow arrowheads and dotted circle indicate biofilm-like structures. e, f The inflammatory cytokine expressions of mice serum (e) and peritoneal lavage (f) at day 1 (n = 10 for infected groups, n = 3 for baseline). Representative images from three independent experiments are shown. g Normalized RNAIII expression of bacteria in peritoneal lavage fluid at day1 (CN02agr+: n = 5, CN08agr–: n = 5, CN17EA: n = 5) and 2 (CN02agr+: n = 5, CN08agr–: n = 6, CN17EA: n = 6) after infection. Each dot represents an individual mouse. Bars represent mean ± SEM. *p < 0.05, **p < 0.01, ***p < 0.001, Kruskal-Wallis test with two-tailed Dunn’s post-hoc test.

