Fig. 2.
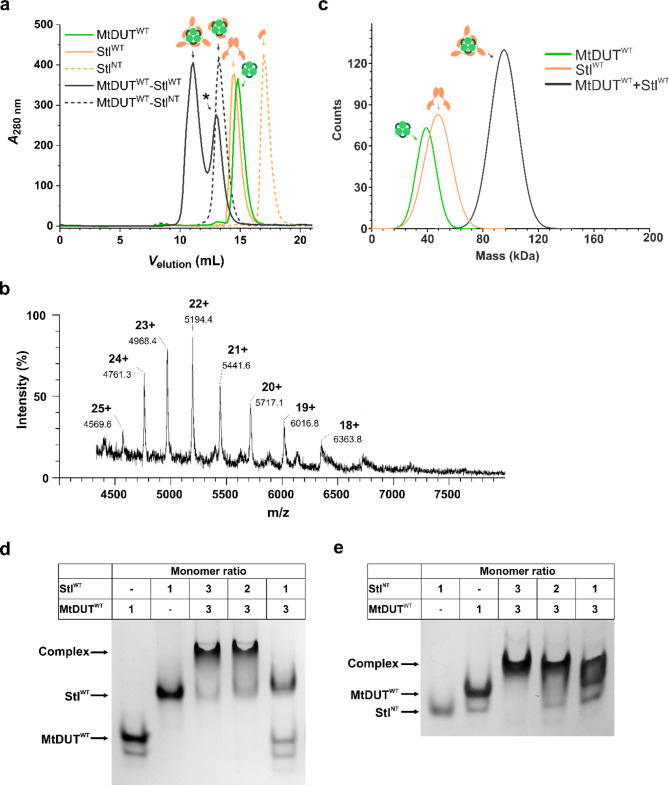
In solution complex formation of MtDUTWTwith StlWTor StlNT. (a) Size exclusion chromatography curves showing the chromatography of individual StlWT, StlNT and MtDUTWT and protein complexes. The curves showing chromatography of StlWT and StlNT proteins are presented in peach colour, as solid and dashed lines, with 14.5 ml and 16.9 ml peak elution volumes, respectively. The MtDUTWT curve is shown as a solid light green line with 14.8 ml peak volume. The curves corresponding to the protein-protein complexes are shown as solid and dashed dark gray lines, with 11.1 ml and 13.0 ml for the MtDUTWT–StlWT complex and 13.2 ml elution peak volume for the MtDUTWT–StlNT complex. The symbols showing the individual proteins, and the protein-protein complexes are similar to the ones presented in Fig. 1. (b) ESI-MS spectra of MtDUTWT-StlWT mixture. The peak series of 4569 (with 25 + charge), 4761 (24+), 4968 (23+), 5194 (22+), 5442 (21+), 5717 (20+), 6017 (19+), 6364 (18+) indicate different charged states of a 114.200(± 0.080) kDa particle that corresponds to a complex with 3:2 binding stoichiometry. (c) Mass photometry histograms showing complex formation between MtDUTWT and StlWT or StlNT. The curves and figures corresponding to the individual proteins or the complex are similar to panel (a). (d-e) Native gel electrophoresis showing complex formation between MtDUTWT and StlWT (d), MtDUTWT and StlNT (e) at different mixing ratios.

