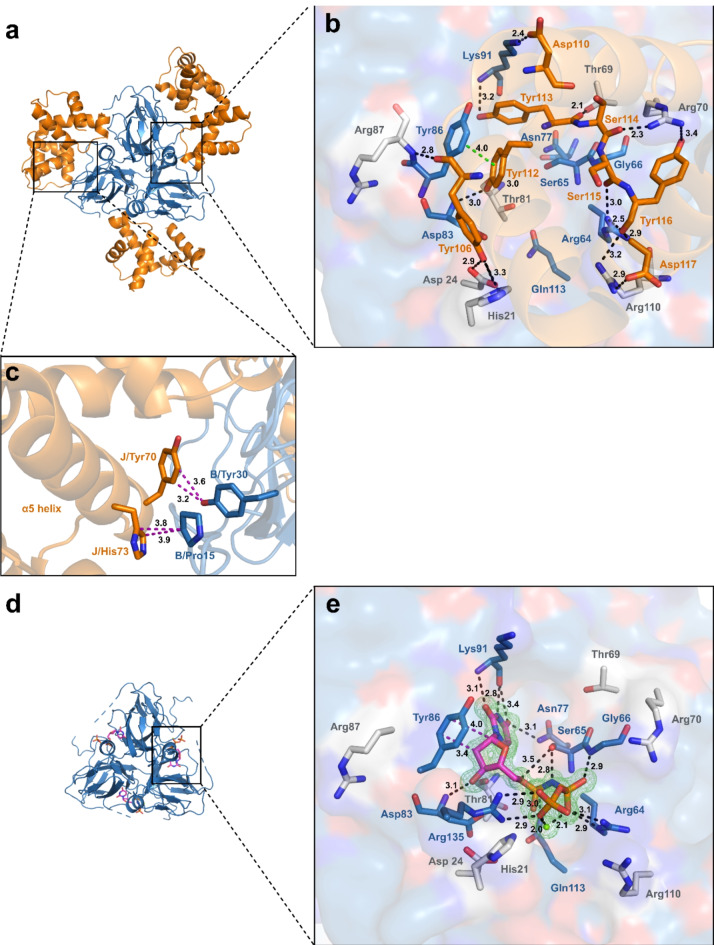
Fig. 3.
Structure-based comparison of the MtDUTWT-StlNTand MtDUTΔloop–dUPNPP complexes. (a) Overall structure of MtDUTWT–StlNT complex. MtDUTWT is represented as blue cartoon, StlNT is represented as orange cartoon. (b) MtDUTWT active site interactions with StlNT. Substrate analogue interacting residues are displayed as blue stick, while residues interacting only with StlNT are represented as grey sticks, StlNT interacting residues are shown as orange sticks. Interactions are indicated as dashed black (polar), π- π stacking interaction is shown as dashed green line (with distances measured in Å). (c) Interactions of StlNT α5 helix with MtDUTWT. Interacting residues are shown as sticks. Colouring of the proteins are the same as in panel (a). Interactions are shown as dashed purple lines (with distances measured in Å). (d) Overall structure of MtDUTΔloop in complex with dUPNPP substrate analogue. MtDUTΔloop is displayed as blue cartoon, substrate analogue is represented as sticks. (e) Active site interactions of MtDUTΔloop in complex with dUPNPP. MtDUTΔloop is represented as surface. The representation of interacting residues is the same as on panel (b). The omit map around substrate analogue and Mg2+-ion (green sphere) is contoured in green isomesh at 3.0σ level. Interactions are indicated as dashed black (polar) and purple (hydrophobic) lines (with distances measured in Å). Individual panels were created using PyMOL 2.5.4 (Schrodinger, LLC; https://www.pymol.org/). The figure was assembled using CorelDRAW 2020 (Corel Corporation; https://www.coreldraw.com).

