Fig. 6.
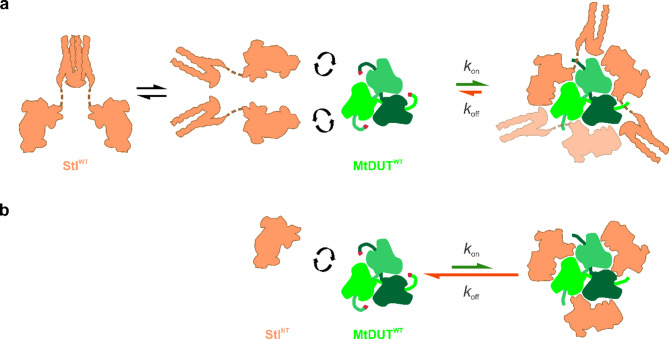
Schematic representation of enzyme-inhibitor protein complex formation for the different truncated mutants. (a) MtDUTWT-StlWT complex formation. (b) MtDUTWT–StlNT complex formation. (a, b) The representations of the individual molecules are similar to the ones as on Figure S2. The protein-protein complexes are shown as the complexes of the individual proteins, which representations are based on MtDUTWT-StlNT structural model (PDB ID: 8P8O), the exact conformation of the proteins and their binding stoichiometry are not taken into account. The magnitude of kon and koff values determined in the BLI measurements are represented as green and red arrows, respectively. Please note, that the dimensions of kon and koff values are different. Therefore, only the same kind of rate constants from the different complex formation reactions are comparable with each other. Figure was created using CorelDRAW 2020 (Corel Corporation; https://www.coreldraw.com).

