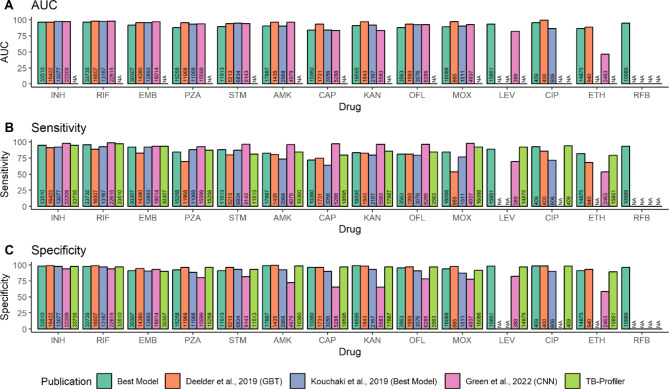
Fig. 1.
Comparing predictive performance of our ’Best Model’ to models from previously published studies. AUC (A), sensitivity (B) are specificity (C) are compared between our ’best model’ as highlighted in Table 2 to TB-Profiler and previously published models: Deelder et al., 2019 (GBT-CRM), Kouchaki et al., 2019 (Best Ensemble Tree Model) and Green et al., 2022 (CNN). ’NA’ indicates where no samples were available for prediction for that specific drug. Numbers inside bars represent the number of samples available for each drug in each study. TB-Profiler results were made using the samples used in this study. INH isoniazid, RIF rifampicin, EMB ethambutol, PZA pyrazinamide, STM streptomycin, AMK amikacin, CAP capreomycin, KAN kanamycin, CIP ciprofloxacin, OFL ofloxacin, MOX moxifloxacin, ETH ethionamide, LEV levofloxacin, RFB rifabutin. Low numbers of resistant isolates were available for ethionamide and ciprofloxacin prediction by Green et al., (2022) so performance was not assessed.

