

Abstract
Background
Patients with severe mitral stenosis (MS) in normal sinus rhythm (NSR), presenting with left atrial appendage (LAA) inactivity and associated left atrial spontaneous echo contrast (LASEC) are prone to left atrium (LA) or LAA thrombus formation. But unlike for atrial fibrillation, oral anticoagulants are not commonly prescribed for this patient subset. This study aimed to compare the levels of procoagulants and fibrinogen in both local (LA) and systemic contexts between patients with severe MS in NSR vs those in healthy control subjects.
Methods
The study involved 35 patients with severe MS in NSR with LAA inactivity and LASEC who were eligible for balloon mitral valvuloplasty vs 35 healthy controls. All patients underwent transthoracic and transesophageal echocardiography to assess MS severity, LAA activity, and LASEC grade, and had blood samples analyzed for procoagulant levels.
Results
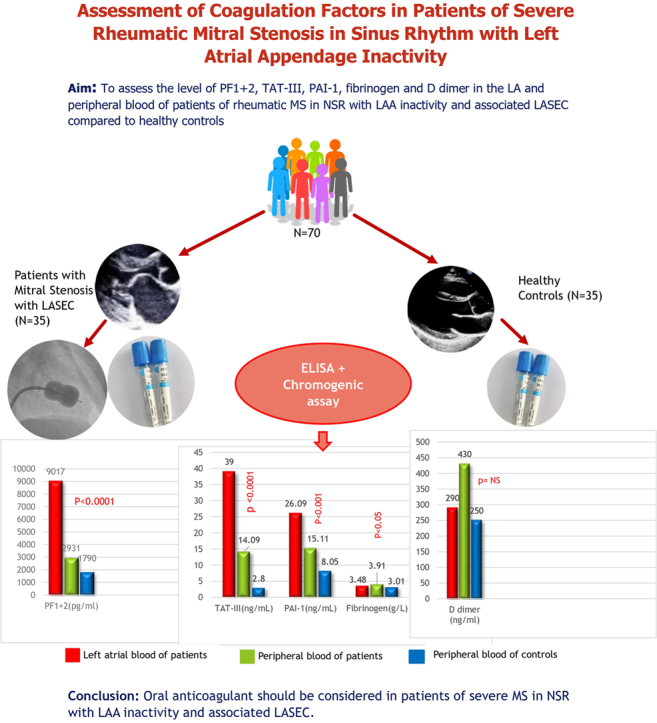
Results showed comparable baseline characteristics between groups, with most patients in the New York Heart Association II or III functional classes, and with varying LASEC grades. Patients exhibited significantly higher levels of prothrombin fragment 1 + 2 [patient vs control, 9017 pg/mL (6228.0-10,963.5) vs 1790 pg/mL (842.3-2712), P < 0.0001], thrombin-antithrombin III [patient vs control, 39 ng/mL (5.45-74.85) vs 2.80 ng/mL (1.6-6.5), P < 0.0001], plasminogen activator inhibitor-1 (patients vs controls, 26.09 ± 8.18 ng/mL vs 8.05 ± 3.53 ng/mL, P < 0.0001), and fibrinogen (3.48 ± 0.89 g/L vs 3.01 ± 0.53 g/L, P = 0.029) in the LA of patients, compared to those in control subjects. Systemic procoagulant levels also were elevated in patients, but D-dimer levels were similar between the 2 groups.
Conclusions
The findings suggest a hypercoagulable state in patients, similar to that in patients with atrial fibrillation. The study advocates for consideration of use of oral anticoagulants in these patients until LA and LAA function improves, to mitigate thrombus formation.
Graphical abstract
Résumé
Contexte
Les patients atteints d’une sténose mitrale sévère au rythme sinusal normal, présentant une inactivité de l’appendice auriculaire gauche et un écho de contraste spontané de l’oreillette gauche associé, sont vulnérables à la formation de thrombus à l’oreillette gauche et à l’appendice auriculaire gauche. Cependant, contrairement au traitement de la fibrillation auriculaire, les anticoagulants oraux ne sont pas fréquemment prescrits à ce sous-groupe de patients. Cette étude visait à comparer les taux de procoagulants et de fibrinogène à l’échelle locale (oreillette gauche) et à l’échelle de l’organisme entre des patients atteints de sténose mitrale sévère au rythme sinusal normal et des témoins en bonne santé.
Méthodologie
L’étude comptait 35 patients atteints de sténose mitrale sévère au rythme sinusal normal présentant une inactivité de l’appendice auriculaire gauche et un écho de contraste spontané de l’oreillette gauche admissibles pour une valvuloplastie mitrale percutanée ainsi que 35 témoins en bonne santé. Tous les patients ont été soumis à une échocardiographie transthoracique et transœsophagienne visant à évaluer la gravité de la sténose mitrale, l’activité de l’appendice auriculaire gauche et le grade de l’écho de contraste spontané de l’oreillette gauche; des échantillons de sang ont également été prélevés pour le dosage des procoagulants.
Résultats
Les résultats ont révélé des caractéristiques initiales comparables entre les groupes, la plupart des patients se trouvant dans les classes fonctionnelles II ou III de la New York Heart Association et présentaient des grades variés pour l’écho de contraste spontané de l’oreillette gauche. Comparativement à ce qui a été observé chez les témoins en bonne santé, des taux significativement plus élevés de fragment de prothrombine 1 + 2 [patients vs témoins, 9017 pg/mL (6228,0-10 963,5) vs 1790 pg/mL (842,3-2712), p < 0,0001], de thrombine-antithrombine III [patients vs témoins, 39 ng/mL (5,45-74,85) vs 2,80 ng/mL (1,6-6,5), p < 0,0001], d’inhibiteur 1 de l’activateur du plasminogène (patients vs témoins, 26,09 ± 8,18 ng/mL vs 8,05 ± 3,53 ng/mL, p < 0,0001) et de fibrinogène (3,48 ± 0,89 g/L vs 3,01 ± 0,53 g/L, p = 0,029) ont été mesurés dans l’atrium gauche des patients. Les taux de procoagulants à l’échelle de l’organisme étaient également élevés chez les patients, mais les taux de D-dimère étaient similaires entre les 2 groupes.
Conclusions
Les observations indiquent un état d’hypercoagulabilité chez les patients comparable à celui observé chez les patients atteints de fibrillation auriculaire. L’étude est favorable à l’idée d’utiliser des anticoagulants oraux chez ces patients jusqu’à ce que la fonction de l’oreillette gauche et de l’appendice auriculaire gauche s’améliore, afin de réduire la formation de thrombus.
Thromboembolic events are a major cause of morbidity and mortality in patients with mitral stenosis (MS).1,2 Although left atrium (LA) and/or left atrial appendage (LAA) thrombus formation has been reported in 33% of patients with rheumatic MS in atrial fibrillation (AF),3 it has also been reported in 6.6%-13.5% of patients in normal sinus rhythm (NSR).4, 5, 6, 7
The LAA is the commonest site of thrombus formation. The stasis of blood flow in the LAA, which occurs in the absence of forcible atrial contraction during AF, initiates the clot-formation process and leads to the occurrence of arterial thromboembolic events.7,8 Saygi et al.6 in an interesting study, have shown that in patients with MS, an impairment of LA and/or LAA contractility occurs to a similar extent, irrespective of whether a patient is in sinus rhythm (SR) or AF. Impairment of LA and/or LAA contractility leads to stasis of blood with formation of smoke in LA and/or LAA [left atrial spontaneous echo contrast (LASEC)], which in turn has been found to be a positive predictor of LA and/or LAA thrombus formation in patients with rheumatic MS in NSR.7,9, 10, 11 A number of small studies also have reported that patients with severe rheumatic MS in NSR with associated LASEC have increased atrial and systemic levels of procoagulants.9,12,13
However, the American College of Cardiology/American Heart Association (ACC/AHA) 2020 guidelines on valvular heart disease14 still do not recommend use of oral anticoagulants (OACs) in patients with severe rheumatic MS in NSR with associated LASEC. As stasis of blood (LASEC being a marker of stasis) and a hypercoagulable state are prerequisites for thrombus formation, we decided to carry out a study that was adequately powered to assess the level of procoagulants in patients with severe MS in NSR with associated LASEC.
Materials and Methods
This prospective observational study was conducted from August 2021 to January 2023 at a tertiary-care centre in New Delhi. The study aimed to assess and compare the level of procoagulants in patients with severe rheumatic MS in NSR vs that in healthy control participants. The ethics committee at our institution approved this study, and all patients provided written informed consent.
Primary and secondary objectives
The primary objective was to assess the level of procoagulant prothrombin fragment 1 + 2 (PF1 + 2) in the LA and peripheral blood of patients with rheumatic MS in NSR, compared to that in healthy control participants. The secondary objectives were to assess the level of thrombin-antithrombin III complex (TAT III; byproduct of thrombin generation), plasminogen activator inhibitor-1 (PAI-1; marker of fibrinolytic system activation), fibrinogen, and D dimer, compared to the levels in healthy control participants.
Sample size
Based on a previous study by Atak et al.,12 the mean standard deviation (SD) of PF1 + 2 in the LA blood of rheumatic MS patients in NSR and associated LASEC was 4050 pg/mL (± 2100), and in the systemic blood of healthy control subjects, it was 2020 pg/mL (± 1400). Considering 1500 pg/mL to be a clinically important difference between the disease group and the healthy control group, and assuming a SD of 2100 pg/mL in both groups, a sample of 32 subjects in each arm was needed, with a power of 80% and a 5% level of significance. Thus, for the present study, we recruited 35 patients and 35 healthy control subjects, to reduce the margin of error.
Patients
The participants in the study group were men or women aged > 18 years with severe rheumatic MS [mitral valve area (MVA) ≤ 1.5 cm2 by planimetry], a valve suitable for balloon mitral valvuloplasty, and associated LASEC with LAA inactivity [LAA emptying velocity (LAAEV) < 25 cm/s].15,16
Patients were excluded from the study if they had LA and/or LAA thrombus on echocardiography, AF, coexisting left ventricular dysfunction (ejection fraction <50%), congenital heart disease, or any contraindication for transesophageal echocardiography (TEE). Patients also were excluded if they had diabetes mellitus, hypertension, renal or hepatic dysfunction, overt malignancy, pregnancy, chronic inflammatory disease such as systemic lupus erythematosus, rheumatic arthritis, human immunodeficiency virus infection, a history of systemic or pulmonary embolism, or an associated COVID-19 infection.
Control Participants
A total of 35 healthy volunteers were included as control participants for the study. The control subjects had no echocardiographic evidence of structural heart disease and were in SR; all their other exclusion criteria were identical to those of the study patients.
Echocardiography
All patients underwent detailed transthoracic echocardiography, to evaluate valvular involvement in the study group and exclude cardiac disease in control subjects, using a Philips EPIQ 7C (Koninklijke, Philips N.V.) echocardiography machine fitted with a commercially available 5-MHz transducer. Two-dimensional and Doppler echocardiographic studies were performed in the left lateral decubitus position in conventional views (parasternal long, short-axis, and apical 2- and 4-chamber views), according to American Society of Echocardiography guidelines.17 A 1-lead electrocardiogram was recorded continuously during the TEE (informed written consent was taken from all patients before multiplane TEE was performed) using a Philips EPIQ 7C fitted with a commercially available 5-MHz X7-2t transducer. The LA and LAA imaging were begun in the horizontal plane at 0°; then, the transducer was rotated progressively to 60° and 90° in the same plane, and images also were evaluated after a slight and more pronounced anticlockwise rotation of the probe. The rotation of the transducer to 110° and 130° was coupled with a more pronounced anticlockwise rotation of the probe. All images were recorded by optimizing the gain settings to minimize gray-noise artifacts. We examined the LAA on the short axis and the long axis. TEE has been shown to be highly sensitive for the detection of LA clots, especially in the LAA.18
An LA or LAA thrombus was diagnosed by the presence of a clearly defined echogenic intracavitary mass that was different from the underlying endocardium. Spontaneous echo contrast was diagnosed by the presence of dynamic smoke-like echoes in the LA cavity and LAA with a characteristic swirling motion. Patients with LA and/or LAA thrombus were excluded from the study. The severity of spontaneous echo contrast was graded from 0 to 4+, as proposed by Fatkin et al.,19 as follows: grade 0 = none (absence of echogenicity); grade 1+ = mild (minimal echogenicity located in the LAA or distributed sparely in the main cavity of the LA; may be detectable only transiently during the cardiac cycle; imperceptible at operating gain settings for 2-dimensional echocardiographic analysis); grade 2+ = mild to moderate (denser swirling pattern than grade 1+ but with similar distribution; detectable without increased gain settings); grade 3+ = moderate (dense swirling pattern in the LAA, generally associated with a somewhat lesser intensity in the main cavity; may fluctuate in intensity but be detectable constantly throughout the cardiac cycle); grade 4+ = severe (intense echo density and very slow swirling patterns in the LAA, usually with similar density in the main cavity).
LAA velocity
The LAA flow profiles were obtained by placing the sample volume of the pulsed Doppler 1 cm below the LAA orifice, where no wall artifacts occurred and a net flow could be recorded using pulse-wave Doppler. The positive flow observed after the P-wave of the surface electrocardiogram was taken as the LAAEV, representing the LAA contractile function. Inactive LAA was defined as late peak LAAEV < 25 cm/s.15,16 As in our previous study,20 LAAEV was recorded in 3 consecutive cycles in 2 views (midesophageal short-axis view and 2-chamber view). Only those patients with mean LAAEV values of <25 cm/s in both the views were enrolled in the study. All echocardiograms were evaluated independently by 2 observers, and any difference of opinion was settled by mutual consensus.
Valvuloplasty procedure
In the catheterization laboratory, introducer sheaths were inserted into the right femoral artery and vein. A 6F polymer pigtail catheter was inserted into the left ventricle, to measure pressure. A transseptal puncture was performed with the help of a Brockenborough needle (Medtronic, Minneapolis, MN) in a 6F Mullins sheath (Medtronic), and the mitral valve (MV) was dilated with an Inoue Balloon catheter (Toray, Tokyo, Japan).21 No thromboembolic events occurred in any patient during or after the valvuloplasty procedure.
Blood sampling
Prevalvuloplasty peripheral blood samples were drawn from a femoral vein sheath and were transferred immediately to an ethylenediaminetetraacetic acid (EDTA) tube containing 3.8% sodium citrate. Immediately after transseptal puncture, LA prevalvuloplasty samples were withdrawn from all 35 patients through the transseptal catheter (Mullin sheath), before administration of heparin. Prior to collection of the blood samples, a saline flush was performed to clear any potential contaminants from the catheter. This step helps ensure that the blood samples collected from the LA reflect the true intra-atrial environment rather than contamination from the puncture site. To further minimize the risk of contamination, the first few milliliters of blood were discarded before the samples used for analysis were collected. This approach helps reduce the likelihood of including any tissue factors introduced during the puncture process. In control subjects, peripheral venous blood samples were collected through a needle puncture after the initial 3 mL of blood was discarded. Blood samples for procoagulants were immediately (within 2 hours) centrifuged at 3000 x g for 15 minutes, and the collected plasma was stored at –70°C in several aliquots in our biochemistry laboratory for assessment in a blinded manner.
Hematological investigations
Baseline laboratory tests (hemogram, erythrocyte segmentation rate, C-reactive protein, renal function test, liver function test, prothrombin time, activated partial thromboplastin time, fibrinogen, and platelet count) were done in all subjects in our study (patients and control subjects).
Assay procedure
A peripheral venous blood sample of control subjects for measuring levels of plasma coagulation parameters, including PF1 + 2, TAT-III, and PAI-1, was drawn in the morning between 8 AM and 10 AM. Samples were taken by inserting 21-G vacuum tube phlebotomy needles into 3.8% 1:9 trisodium citrate–containing tubes, without venous stasis. Both LA blood and femoral vein samples of patients were taken during balloon mitral valvuloplasty before administration of heparin and were transferred immediately to 3.8% 1:9 trisodium citrate–containing tubes. The plasma was separated by centrifugation of blood (3000 x g for 15 minutes) and stored in several aliquots at –70°C until it was used for the assay.
During thrombin generation, the amino terminus of the prothrombin molecule is released as the inactive PF1 + 2. Once evolved, thrombin converts fibrinogen into fibrin, which crosslinks to form thrombus, thereby releasing fibrinopeptide A (FPA) and B (FPB), or it can be inhibited by the endogenous heparin sulfate-antithrombin III mechanism to form the TAT-III complex, which is a stable enzyme-inhibitor. Thus, PF1 + 2 and TAT-III are the markers of thrombin generation.22
The fibrinolytic system consists of a series of activators and inhibitors that regulate the conversion of plasminogen to plasmin. The major activators of plasminogen are tissue-type plasminogen activator and urokinase, both of which are inactivated by the circulating inhibitor, PAI. Freely circulating plasmin is inactivated by α2-plasmin inhibitor, forming a plasmin-α2-plasmin inhibitor complex. On the other hand, fibrin formed from fibrinogen is hydrolyzed by plasmin, releasing D-dimer. Thus, both plasmin-α2-plasmin inhibitor complex and D-dimer levels reflect fibrinolytic status, whereas PAI is a marker of impaired fibrinolysis.22
Plasma PF1 + 2 concentration, used as a marker of in vivo thrombin generation, was measured using a quantitative sandwich enzyme-linked immunosorbent assay method (QuicKey Pro ELISA KIT, Elabscience, Houston, TX), normal human plasma values: 31.2-2000 pg/mL; intra- and inter-coefficients of variation < 10%). Plasma TAT-III concentration, also a marker of in vivo thrombin generation, was measured using a quantitative sandwich enzyme-linked immunosorbent assay method (ELISA KIT, Elabscience USA; normal human plasma values: 0.5-10 ng/mL; intra- and inter-coefficients of variation < 10%). PAI-1, used as a marker of endogenous fibrinolytic activity, was measured using a quantitative sandwich enzyme-linked immunosorbent assay (Elabscience, USA; normal plasma values: 5-40 ng/mL; intra- and inter-assay coefficients of variation are < 10%). Plasma fibrinogen was assayed by the direct chromogenic method. D-dimer was measured with a particle-enhanced immune-turbidimetric method. The analysis of plasma samples was done in the biochemistry department of our hospital in a blinded manner.
Statistical analysis
The categorical variables are presented as numbers and percentages.The quantitative data are presented as mean ± SD, and as median with the 25th and 75th percentiles, with interquartile ranges. The data's normality was checked using the Kolmogorov-Smirnov test. In cases in which the data were not normal, we used nonparametric tests. The comparison of the variables that were quantitative and not normally distributed in nature was performed using the Mann-Whitney U test (for 2 groups), and the variables that were quantitative and normally distributed were analyzed using the independent Student t test (for 2 groups). A paired t test and Wilcoxon signed rank test was used for comparison between peripheral blood and LA blood. The comparison of the variables, which were qualitative in nature, was conducted using the χ2 test. If any cell of a contingency table had an expected value of < 5, then Fisher’s exact test was used.
The data entry was done in using an Excel spreadsheet (Microsoft, Redmond, WA), and the final analysis was done using Statistical Package for Social Sciences (SPSS) software, version 25.0 (IBM, Chicago). A P value < 0.05 was considered statistically significant.
Results
The study was conducted from August 2021 to January 2023 at Govind Ballabh Pant Institute of Postgraduate Medical Education and Research (GIPMER), in New Delhi, and enrolled 35 patients with severe rheumatic MS in NSR with associated LASEC, and an equal number of healthy control subjects. No statistically significant differences were observed in terms of age, sex, or body mass index between the 2 study groups. The average age for both groups was 32 years, and approximately two-thirds of the subjects were female (Table 1). Hematological parameters and coagulation profiles were found to be comparable between the patient and control groups (Table 2).
Table 1.
Baseline characteristics of the study population
| Variables | MS in SR group (n = 35) | Control group (n = 35) | P |
|---|---|---|---|
| Age, y | 32.24 ± 7.44 | 32.93 ± 2.64 | 0.791 |
| Sex, female | 24 (68.57) | 23 (65.7) | 0.799 |
| BMI, kg/m2 | 22.01 ± 2.88 | 21.63 ± 2.25 | 0.739 |
| NYHA functional HF classification | |||
| II | 13 (37.14) | ||
| III | 21 (60) | ||
| IV | 1 (2.87) |
Values are mean ± standard deviation, or n (%), unless otherwise indicated.
BMI, body mass index; HF, heart failure; MS, mitral stenosis; NYHA, New York Heart Association; SD, standard deviation; SR, sinus rhythm.
Table 2.
Comparison of hematological parameters between patients with mitral stenosis (MS) in sinus rhythm (SR) vs a control group
| Variables | MS in SR group (n = 35) | Control group (n = 35) | P |
|---|---|---|---|
| Hemoglobin, g/dL | 12.91 ± 1.62 | 13.03 ± 2.05 | 0.662 |
| Hematocrit, % | 40.39 ± 4.37 | 40.95 ± 5.85 | 0.925 |
| Platelet count, thousand/mm3 | 233.26 ± 73.58 | 256.63 ± 66.2 | 0.091 |
| SGOT, IU/L | 24.8 ± 8.05 | 20.7 ± 6.17 | 0.020 |
| SGPT, IU/L | 20.14 ± 9.99 | 19.07 ± 7.3 | 0.611 |
| Total bilirubin, mg/dL | 0.67 ± 0.36 | 0.65 ± 0.24 | 0.218 |
| Total protein, g/dL | 7.68 ± 0.55 | 7.57 ± 0.37 | 0.112 |
| CRP, mg/dL, median (IQR) | 1.1 (0.50–2.85) | 1.32 (0.90–4.10) | 0.211 |
| ESR, mm/h | 19.06 ± 10.48 | 24.84 ± 16.47 | 0.143 |
| Bleeding time, s | 72 ± 17.54 | 72.87 ± 16.59 | 0.435 |
| Clotting time, s | 591.57 ± 59.13 | 591.53 ± 86.42 | 0.987 |
| INR | 0.92 ± 0.12 | 0.95 ± 0.1 | 0.790 |
| aPTT, s | 25.45 ± 5.56 | 25.85 ± 6.59 | 0.784 |
Values are mean ± standard deviation, unless otherwise indicated.
aPTT, activated partial thromboplastin clotting time; CRP, C-reactive protein; ESR, erythrocyte sedimentation rate; INR, international normalized ratio; IQR, interquartile range; SGOT, serum glutamic-oxaloacetate transaminase; SGPT, serum glutamate pyruvate transaminase.
This study included patients diagnosed with severe MS (MVA ≤ 1.5 cm2), and the mean MVA was 0.85 cm2 by planimetry. TEE revealed that the majority of patients exhibited grades 3+ (n = 17; 48.57%) or 4+ LASEC (n = 15; 42.86%). The mean LAAEV was 16.38 ± 4.04 cm/s, as all our patients had inactive LAA as an inclusion criterion. The mean gradient across the MV was 15.2 ± 5.1 mm Hg, suggestive of severe MS (Table 3).
Table 3.
Echocardiographic parameters in patients with mitral stenosis in sinus rhythm vs a control group
| Echo parameters | Patients (n = 35) | Control group (n = 35) | P |
|---|---|---|---|
| LAD, cm | 5.1 ± 0.75 | 3.003 ± 0.2738 | < 0.00001 |
| LVEF, % | 61.74 ± 6.2 | 61.43 ± 2.831 | 0.623 |
| PASP, mm Hg | 61.17 ± 20.52 | 14.06 ± 2.743 | < 0.00001 |
| MVA, cm2 by planimetry | 0.85 ± 0.4 | 4.97 ± 0.4083 | < 0.00001 |
| PG across MV, mm Hg | 24.2 ± 6.96 | 7.31 ± 1.102 | < 0.0001 |
| MG across MV, mm Hg | 15.2 ± 5.1 | 1.74 ± 0.852 | < 0.0001 |
| LASEC grade | |||
| 1+ | 0 (0) | ||
| 2+ | 3 (8.57) | ||
| 3+ | 17 (48.57) | ||
| 4+ | 15 (42.86) | ||
| LAAEV, cm/s | 16.38 ± 4.04 | ||
| Wilkins score | 8.03 ± 0.95 | ||
Values are mean ± standard deviation, or n (%), unless otherwise indicated.
LAAEV, left atrial appendage emptying velocity; LAD, left atrial diameter; LASEC, left atrial spontaneous echo contrast; LVEF, left ventricular ejection fraction; MG, mean gradient; MV, mitral valve; MVA, mitral valve area; PASP, pulmonary artery systolic pressure; PG, peak gradient.
Significant elevations of procoagulants, specifically PF1 + 2 and TAT-III, were observed in patients, compared to the levels in control subjects. In the patient group, the systemic level of PF1 + 2 was significantly higher than that in the healthy control group (2931 pg/mL [1626-7770] vs 1790 pg/mL [842.3-2712]; P < 0.0001), indicating the presence of a systemic hypercoagulable state (Table 4). Moreover, the LA level of PF1 + 2 was significantly higher than the systemic level in patients, primarily attributable to increased activation of the coagulation system in the LA compared to peripheral blood. Similarly, the systemic level of TAT-III was significantly higher in patients, compared to that in control subjects (14.09 ng/mL [4.9-42.725] vs 2.80 ng/mL (1.60-6.50); P < 0.0001], and the LA level of TAT-III showed a significant elevation relative to the systemic levels in patients [39 ng/mL (5.45-74.85) vs 2.80 ng/mL (1.60-6.50); P < 0.0001; Table 4).
Table 4.
Comparison of coagulation factors and fibrinolytic system in patients with mitral stenosis vs control subjects
| Variable of dispersion | PE blood of patients (n = 35) | LA blood of patients (n = 35) | PE blood of control subjects (n = 35) | P (LA blood of patients vs PE blood of control subjects) | P (PE blood of patients vs control subjects) | P (PE blood vs LA blood of patients) |
|---|---|---|---|---|---|---|
| PF1 + 2, pg/mL | ||||||
| 2931 (1626–7770) | 9017 (6032–10,963.5) | 1790 (842.3–2712) | < 0.0001 | < 0.0001 | < 0.00001 | |
| TAT-III, ng/mL | ||||||
| 14.09 (4.9–42.725) | 39 (5.45–74.85) | 2.80 (1.60–6.50) | < 0.0001 | < 0.0001 | < 0.00001 | |
| PAI-1, ng/mL | ||||||
| 15.11 ± 6.74 | 26.09 ± 8.18 | 8.05 ± 3.53 | <0.0001 | 0.001 | <0.001 | |
| Plasma fibrinogen, g/L | ||||||
| 3.91 ± 1.29 | 3.48 ± 0.89 | 3.01 ± 0.53 | 0.029 | 0.001 | 0.53 | |
| D-dimer, ng/mL | ||||||
| 430 (230–690) | 290 (110–610) | 250 (160–460) | 0.061 | 0.737 | 0.485 | |
Values are median (25th–75th percentile), or mean ± standard deviation, unless otherwise indicated.
PAI-1, plasma activator inhibitor 1; PE, peripheral; PF1 + 2, prothrombin fragment 1 + 2; TAT-III, thrombin antithrombin III complex.
In addition to the observed increase in thrombin generation in the left atrium, the patient group also displayed impairment of the fibrinolytic system. The systemic level of PAI-1 was elevated in patients with MS, compared to that in healthy control subjects, indicative of systemic impaired fibrinolytic activity. Furthermore, the LA level of PAI-1 was significantly higher than the systemic level, suggesting a significant hypercoagulable state in the LA compared to the periphery in the patient group (26.09 ± 8.18 ng/mL vs 8.05 ± 3.53 ng/mL; P < 0.0001; Table 4). Accordingly, the level of D-dimer (end product of fibrin degeneration) was not significantly different in the LA of patients compared to that in control subjects, suggesting that the fibrinolytic system in this subset of patients had significant impairment (Table 4).
The mean plasma fibrinogen concentration in the peripheral blood of the patients was 3.91 ± 1.29 g/L, whereas in the LA, it was 3.48 ± 0.89 g/L. In comparison, the control group exhibited a mean fibrinogen level of 3.01 ± 0.53 g/L. Statistical analysis revealed no significant disparity between the systemic and LA fibrinogen levels in the patient group (P = 0.104). Nevertheless, these levels were elevated notably, compared to those in the healthy control group, suggesting the presence of a hypercoagulable state in patients with MS in SR (Table 4).
Discussion
To the best of our knowledge, this study is the first that is adequately powered to systematically evaluate the levels of procoagulants in the LA of patients with rheumatic MS, in SR with LAA inactivity, and associated LASEC, compared to those of healthy control participants.
As per Virchow's triad,23, 24, 25 the 3 factors required for the formation of a thrombus in a vessel are as follows: (i) endothelial injury; (ii) local blood stasis; and (iii) a hypercoagulable state. The formation of thrombus in patients with MS in AF is attributed to all 3 of these factors. Endothelial damage in the LA has been observed in all MS patients with AF.26 The initiation of AF results in significant deterioration of the ability of both the LA and LAA to contract, causing a stagnation of blood flow. This stagnation leads to the formation of a network of red blood cells and fibrin, resulting in the formation of smoke within the LA and/or the LAA.27 The presence of LA and/or LAA smoke triggers the activation of the coagulation system, resulting in the production of a hypercoagulable environment in the LA and the development of thrombus.9,28,29 Accordingly, to prevent thrombus formation, the latest ACC/AHA guidelines on valvular heart diseases14 recommend use of OACs for all patients with MS in AF, to prevent thrombus formation in the LA and its devastating sequelae of systemic thromboembolism.
The incidence of LA and/or LAA clots in patients with MS in SR has been reported to be 6.6%-13.5%, affecting primarily the young population in our country.4, 5, 6, 7 As in patients of MS in AF, a similar degree of LA endocardial injury has been documented using electron microscopy in patients with MS in SR.26 In addition, we have documented LAA hypocontractility in 73% of patients with MS in SR. We also have shown that LAA inactivity is the only independent predictor of LASEC, a marker of LA and/or LAA stasis in this subset of patients.20
Building on this evidence, numerous small observational studies also have documented a hypercoagulable state in the LA of patients with MS in SR. 9,12,28 Peverill et al.9 found that LASEC is the sole factor that may predict an elevated level of local activity of the coagulation system, regardless of whether patients are in SR or AF. Additionally, these authors demonstrated that the regional concentration of procoagulant (PF1 + 2) was comparable in individuals with MS in AF (n = 9) to that in patients in SR with LASEC (n = 16). We included patients with severe MS and associated LASEC in our investigation. This particular group of patients exhibits both a local9,12 and systemic hypercoagulable state,9,12,13 similar to that observed in patients with AF.30, 31, 32 Atak et al.12 found that individuals with MS in SR had a significantly greater amount of PF1 + 2 in the LA, regardless of LASEC. However, the amount of PF1 + 2 in the peripheral blood was substantially higher in only those patients with LASEC, vs those in the control group. Similarly, Ileri et al.13 found that the peripheral level of PF1 + 2 was considerably elevated in only those patients with MS in SR with LASEC. Peverill et al.9 found that patients with MS in SR with LASEC had significantly greater plasma levels of PF1 + 2 in both the LA and peripheral blood, compared to the levels in patients without LASEC.
According to the latest ACC/AHA guidelines on valvular heart disease,14 use of OACs in patients with severe MS in SR with LASEC is still not recommended, based on the study conducted by Manjunath et al.4 That cross-sectional study recruited 848 individuals with rheumatic MS in SR to investigate the occurrence of LA clot and identify the factors that contribute significantly to this phenomenon. In the study, 6.6% of patients were found to have a clot in the LA and/or LAA. The authors found that LASEC is not a standalone indicator of LA thrombus formation, even though all of their patients with thrombus had associated LASEC. The patients in their study were older,indicating that the period of stasis was longer. However, individuals with an enlarged LA also experience periods of AF without any symptoms. Additionally, elderly patients may have experienced a higher frequency of these episodes, resulting in a more pronounced hypercoagulable state. Manjunath et al.4 have identified this fact as a constraint in their research, as they did not evaluate the amounts of procoagulants at both the local and systemic levels. Table 5 presents a comparison between the subgroup of individuals with LA and/or LAA clot from the study conducted by Manjunath et al.4 vs those from our own investigation. No significant difference occurred between the measures in our analysis vs those for the patients with LA and/or LAA clot in Manjunath's study in the MVA (0.85 ± 0.4 cm2 vs 0.78 ± 0.18 cm2, respectively, P = 0.2572), the LA transverse diameter (5.1 ± 0.75 cm vs 5.1 ± 0.6 cm, respectively, P = 1.0), the average LAAEV (16.38 ± 4.04 cm/s vs 17.9 ± 10.5 cm/s, respectively, P = 0.3206), or the grade of LASEC. Nevertheless, patients in the study conducted by Manjunath et al.4 exhibited a higher age, a higher mean gradient across the MV, and a higher Wilkins score, in comparison to those in our study. Given that the MVA was comparable in the 2 groups, the elevated transmitral gradient likely is attributable to the substantial incidence of subvalvular illness, as indicated by the higher Wilkins score. The primary consequence of a higher transmitral gradient is the heightened resistance that the LA and LAA face, resulting in a decline in their ability to contract, and facilitating the accumulation of impaired blood flow. In our earlier study,20 we demonstrated that a mean gradient of ≥ 11 mm Hg across the MV is a reliable indicator of LAA stasis. This finding holds true for both patient groups, with larger mean gradients observed.
Table 5.
Comparison of parameters between clot group in Manjunath et al.4 study vs those in our study
| Characteristics | Manjunath et al.4 clot group (n = 56) | Our study (n = 35) | P |
|---|---|---|---|
| Age, y | 44.4 ± 8.8 | 32.24 ± 7.44 | < 0.0001 |
| MVA, cm2 | 0.78 ± 0.18 | 0.85 ± 0.4 | 0.2572 |
| MG across MV, mm Hg | 18.5 ± 6.0 | 15.2 ± 5.1 | 0.0083 |
| LASEC | 3.3 ± 1.1 | 3.34 ± 0.626 | 0.8451 |
| LAAEV, cm/s | 17.9 ± 10.5 | 16.38 ± 4.04 | 0.3206 |
| LA transverse diameter, cm | 5.1 ± 0.6 | 5.1 ± 0.75 | 1.00 |
| Wilkins score | 9.4 ± 1.2 | 8.03 ± 0.95 | 0.0001 |
Values are mean ± standard deviation, unless otherwise indicated.
LA, left atrium; LAAEV, left atrial appendage emptying velocity; LASEC, left atrial spontaneous echo contrast; MG, mean gradient; MV, mitral valve; MVA, mitral valve area.
The 2021 European Society of Cardiology guidelines for the management of valvular heart disease33 also have suggested that OACs be used in a specific group of patients—those with severe MS who have dense LASEC or an enlarged LA with a transverse diameter > 5 cm. In our study, we demonstrated a significant increase in the levels of procoagulants in patients who exhibit both of these features. Considering the fraction of MS patients in SR with grade 3+ or 4+ LASEC who have a notably elevated level of procoagulants in the LA and/or LAA, along with a systemic hypercoagulable state, we believe consideration of administering OACs to avoid thrombus formation is appropriate. We believe that, in contrast to patients with MS and AF, who need to take OACs for the rest of their lives, all patients with MS in SR and with grade 3+ or 4+ LASEC should be prescribed OACs until the local hypercoagulable milieu is altered by relieving the obstruction across the MV. Research has demonstrated that by performing valvuloplasty to alleviate the obstruction in the MV, the LA afterload is reduced, resulting in an improvement in LA and/or LAA contractility,34,35 a decrease in stasis,36,37 and a decrease in the level of procoagulants.38,39 Hence, based on our study results, we feel that OAC use should be considered for all patients with severe MS in NSR with grade 3+ or 4+ LASEC, with such treatment being continued until an improvement occurs in LA and/or LAA function following valvuloplasty or MV surgery.
Conclusion
Both local and systemic levels of procoagulants were raised significantly in patients with severe MS in NSR with LAA inactivity and associated grade 3+ or 4+ LASEC, as compared to those in control subjects, suggestive of the presence of a hypercoagulable state in the former group, similar to that reported in patients with AF. Hence, we feel that OAC treatment should be considered in this subgroup of patients to prevent thrombus formation until an improvement occurs in LA and LAA function following valvuloplasty or MV surgery.
Acknowledgements
The authors are thankful to Dr. Rajeev Kumar Malhotra, scientist (statistician), Delhi Cancer Registry, Dr. B.R.A. IRCH, AIIMS, Delhi, for statistical analysis.
Ethics Statement
The ethics committee at our institution approved this study (approval no.: F.1/IEC/MAMC/85/04/2021/NO.485, dated October 13, 2021), and all patients provided written informed consent.
Patient Consent
The authors confirm that patient consent forms have been obtained for this article.
Funding Sources
The authors have no funding sources to declare.
Disclosures
The authors have no conflicts of interest to disclose.
Declaration of Generative AI and AI-Assisted Technologies in the Writing Process
No artificial intelligence (AI)– assisted technologies (such as large language models [LLMs], chatbots, or image creators) were used in the production of the submitted work.
Footnotes
See page 1238 for disclosure information.
To access the supplementary material accompanying this article, visit CJC Open at https://www.cjcopen.ca/ and at https://doi.org/10.1016/j.cjco.2024.07.004.
Supplementary Material
References
- 1.Acartürk E., Usal A., Demir M., Akgül F., Ozeren A. Thromboembolism risk in patients with mitral stenosis. Jpn Heart J. 1997;38:669–675. doi: 10.1536/ihj.38.669. [DOI] [PubMed] [Google Scholar]
- 2.Neilson G.H., Galea E.G., Hossack K.F. Thromboembolic complications of mitral valve disease. Aust N Z J Med. 1978;8:372–376. doi: 10.1111/j.1445-5994.1978.tb04904.x. [DOI] [PubMed] [Google Scholar]
- 3.Srimannarayana J., Varma R.S., Satheesh S., Anilkumar R., Balachander J. Prevalence of left atrial thrombus in rheumatic mitral stenosis with atrial fibrillation and its response to anticoagulation: a transesophageal echocardiographic study. Indian Heart J. 2003;55:358–361. [PubMed] [Google Scholar]
- 4.Manjunath C.N., Srinivasa K.H., Panneerselvam A., et al. Incidence and predictors of left atrial thrombus in patients with rheumatic mitral stenosis and sinus rhythm: a transesophageal echocardiographic study. Echocardiography. 2011;28:457–460. doi: 10.1111/j.1540-8175.2010.01361.x. [DOI] [PubMed] [Google Scholar]
- 5.Saidi S.J., Motamedi M.H. Incidence and factors influencing left atrial clot in patients with mitral stenosis and normal sinus rhythm. Heart. 2004;90:1342–1343. doi: 10.1136/hrt.2003.024315. [DOI] [PMC free article] [PubMed] [Google Scholar]
- 6.Saygi S., Turk U.O., Alioglu E., et al. Left atrial appendage function in mitral stenosis: Is it determined by cardiac rhythm? J Heart Valve Dis. 2011;20:417–424. [PubMed] [Google Scholar]
- 7.Goswami K.C., Yadav R., Rao M.B., et al. Clinical and echocardiographic predictors of left atrial clot and spontaneous echo contrast in patients with severe rheumatic mitral stenosis: a prospective study in 200 patients by transesophageal echocardiography. Int J Cardiol. 2000;73:273–279. doi: 10.1016/s0167-5273(00)00235-7. [DOI] [PubMed] [Google Scholar]
- 8.González-Torrecilla E., García-Fernández M.A., Pérez-David E., et al. Predictors of left atrial spontaneous echo contrast and thrombi in patients with mitral stenosis and atrial fibrillation. Am J Cardiol. 2000;86:529–534. doi: 10.1016/s0002-9149(00)01007-9. [DOI] [PubMed] [Google Scholar]
- 9.Peverill R.E., Harper R.W., Gelman J., et al. Determinants of increased regional left atrial coagulation activity in patients with mitral stenosis. Circulation. 1996;94:331–339. doi: 10.1161/01.cir.94.3.331. [DOI] [PubMed] [Google Scholar]
- 10.Rittoo D., Sutherland G.R., Currie P., Starkey I.R., Shaw T.R. A prospective study of left atrial spontaneous echo contrast and thrombus in 100 consecutive patients referred for balloon dilation of the mitral valve. J Am Soc Echocardiogr. 1994;7:516–527. doi: 10.1016/s0894-7317(14)80009-6. [DOI] [PubMed] [Google Scholar]
- 11.Khatouri A., Kendoussi M., Elyounassi B., et al. Facteurs prédictifs des complications thrombo-emboliques dans le rétrécissement mitral en rythme sinusal [Predictive factors of thromboembolic complications in mitral stenosis in sinus rythm] Ann Cardiol Angeiol (Paris) 1996;45:573–576. [in French] [PubMed] [Google Scholar]
- 12.Atak R., Yetkin E., Yetkin O., et al. Increased systemic and regional coagulation activity in patients with mitral stenosis and sinus rhythm. Angiology. 2003;54:593–597. doi: 10.1177/000331970305400509. [DOI] [PubMed] [Google Scholar]
- 13.Ileri M., Büyükaşik Y., Ileri N.S., et al. Activation of blood coagulation in patients with mitral stenosis and sinus rhythm. Am J Cardiol. 1998;81:795–797. doi: 10.1016/s0002-9149(97)01025-4. [DOI] [PubMed] [Google Scholar]
- 14.Writing Committee Members. Otto C.M., Nishimura R.A., et al. 2020 ACC/AHA guideline for the management of patients with valvular heart disease: executive summary: a report of the American College of Cardiology/American Heart Association Joint Committee on Clinical Practice Guidelines. J Am Coll Cardiol. 2021;77:450–500. doi: 10.1016/j.jacc.2020.11.035. [DOI] [PubMed] [Google Scholar]
- 15.Caylý M., Kanadaşi M., Demir M., Acartürk E. Mitral annular systolic velocity reflects the left atrial appendage function in mitral stenosis. Echocardiography. 2006;23:546–552. doi: 10.1111/j.1540-8175.2006.00260.x. [DOI] [PubMed] [Google Scholar]
- 16.Daimee M.A., Salama A.L., Cherian G., Hayat N.J., Sugathan T.N. Left atrial appendage function in mitral stenosis: Is a group in sinus rhythm at risk of thromboembolism? Int J Cardiol. 1998;66:45–54. doi: 10.1016/s0167-5273(98)00128-4. [DOI] [PubMed] [Google Scholar]
- 17.Mitchell C., Rahko P.S., Blauwet L.A., et al. Guidelines for performing a comprehensive transthoracic echocardiographic examination in adults: recommendations from the American Society of Echocardiography. J Am Soc Echocardiogr. 2019;32:1–64. doi: 10.1016/j.echo.2018.06.004. [DOI] [PubMed] [Google Scholar]
- 18.Fatkin D., Scalia G., Jacobs N., et al. Accuracy of biplane transesophageal echocardiography in detecting left atrial thrombus. Am J Cardiol. 1996;77:321–323. doi: 10.1016/s0002-9149(97)89406-4. [DOI] [PubMed] [Google Scholar]
- 19.Fatkin D., Kelly R.P., Feneley M.P. Relations between left atrial appendage blood flow velocity, spontaneous echocardiographic contrast and thromboembolic risk in vivo. J Am Coll Cardiol. 1994;23:961–969. doi: 10.1016/0735-1097(94)90644-0. [DOI] [PubMed] [Google Scholar]
- 20.Mukhopadhyay S., Dwivedi Y., Yusuf J., Uppal A., Mehta V. Prevalence and predictors of left atrial appendage inactivity in patients of rheumatic mitral stenosis in sinus rhythm: an observational study. Echocardiography. 2021;38:1860–1869. doi: 10.1111/echo.15223. [DOI] [PubMed] [Google Scholar]
- 21.Grossman W. In: Cardiac Catheterization, Angiography, and Intervention. 6th ed. Baim D.S., Grossman W., editors. Lippincott Williams & Wilkins; Philedelphia: 2000. Profiles in valvular heart disease; pp. 759–785. [Google Scholar]
- 22.Ikeda U., Yamamoto K., Shimada K. Biochemical markers of coagulation activation in mitral stenosis, atrial fibrillation, and cardiomyopathy. Clin Cardiol. 1997;20:7–10. doi: 10.1002/clc.4960200104. [DOI] [PMC free article] [PubMed] [Google Scholar]
- 23.Bagot C.N., Arya R. Virchow and his triad: a question of attribution. Br J Haematol. 2008;143:180–190. doi: 10.1111/j.1365-2141.2008.07323.x. [DOI] [PubMed] [Google Scholar]
- 24.Chung I., Lip G.Y.H. Virchow's triad revisited: blood constituents. Pathophysiol Haemost Thromb. 2003;33:449–454. doi: 10.1159/000083844. [DOI] [PubMed] [Google Scholar]
- 25.Kumar D.R., Hanlin E., Glurich I., Mazza J.J., Yale S.H. Virchow's contribution to the understanding of thrombosis and cellular biology. Clin Med Res. 2010;8:168–172. doi: 10.3121/cmr.2009.866. [DOI] [PMC free article] [PubMed] [Google Scholar]
- 26.Goldsmith I., Kumar P., Carter P., et al. Atrial endocardial changes in mitral valve disease: a scanning electron microscopy study. Am Heart J. 2000;140:777–784. doi: 10.1067/mhj.2000.110284. [DOI] [PubMed] [Google Scholar]
- 27.Izumida Y., Seiyama A., Maeda N. Erythrocyte aggregation: bridging by macromolecules and electrostatic repulsion by sialic acid. Biochim Biophys Acta. 1991;1067:221–226. doi: 10.1016/0005-2736(91)90047-c. [DOI] [PubMed] [Google Scholar]
- 28.Yamamoto K., Ikeda U., Seino Y., et al. Coagulation activity is increased in the left atrium of patients with mitral stenosis. J Am Coll Cardiol. 1995;25:107–112. doi: 10.1016/0735-1097(94)00322-h. [DOI] [PubMed] [Google Scholar]
- 29.Li-Saw-Hee F.L., Blann A.D., Goldsmith I., Lip G.Y. Indexes of hypercoagulability measured in peripheral blood reflect levels in intracardiac blood in patients with atrial fibrillation secondary to mitral stenosis. Am J Cardiol. 1999;83:1206–1209. doi: 10.1016/s0002-9149(99)00060-0. [DOI] [PubMed] [Google Scholar]
- 30.Gustafsson C., Blombäck M., Britton M., Hamsten A., Svensson J. Coagulation factors and the increased risk of stroke in nonvalvular atrial fibrillation. Stroke. 1990;21:47–51. doi: 10.1161/01.str.21.1.47. [DOI] [PubMed] [Google Scholar]
- 31.Lip G.Y., Lowe G.D., Rumley A., Dunn F.G. Increased markers of thrombogenesis in chronic atrial fibrillation: effects of warfarin treatment. Br Heart J. 1995;73:527–533. doi: 10.1136/hrt.73.6.527. [DOI] [PMC free article] [PubMed] [Google Scholar]
- 32.Mitusch R., Siemens H.J., Garbe M., et al. Detection of a hypercoagulable state in nonvalvular atrial fibrillation and the effect of anticoagulant therapy. Thromb Haemost. 1996;75:219–223. [PubMed] [Google Scholar]
- 33.Vahanian A., Beyersdorf F., Praz F., et al. 2021 ESC/EACTS guidelines for the management of valvular heart disease. Eur Heart J. 2022;43:561–632. doi: 10.1093/eurheartj/ehab395. [DOI] [PubMed] [Google Scholar]
- 34.Vijayvergiya R., Sharma R., Shetty R., et al. Effect of percutaneous transvenous mitral commissurotomy on left atrial appendage function: an immediate and 6-month follow-up transesophageal Doppler study. J Am Soc Echocardiogr. 2011;24:1260–1267. doi: 10.1016/j.echo.2011.07.015. [DOI] [PubMed] [Google Scholar]
- 35.Samaan A.A., Hassan A., Hassan M., et al. Left atrial structural and functional remodeling following balloon mitral valvuloplasty. Int J Cardiovasc Imaging. 2021;37:999–1007. doi: 10.1007/s10554-020-02084-0. [DOI] [PubMed] [Google Scholar]
- 36.Ganeswara R.V., Rajasekhar D., Vanajakshamma V. Effect of percutaneous mitral balloon valvuloplasty on left atrial appendage function: transesophageal echo study. Indian Heart J. 2012;64:462–468. doi: 10.1016/j.ihj.2012.07.008. [DOI] [PMC free article] [PubMed] [Google Scholar]
- 37.Fatkin D., Roy P., Sindone A., Feneley M. Rapid onset and dissipation of left atrial spontaneous echo contrast during percutaneous balloon mitral valvotomy. Am Heart J. 1998;135:609–613. doi: 10.1016/s0002-8703(98)70275-3. [DOI] [PubMed] [Google Scholar]
- 38.Aslanabadi N., Jafaripour I., Toufan M., et al. The effects of percutaneous mitral balloon valvuloplasty on the left atrial appendage function in patients with sinus rhythm and atrial fibrillation. J Cardiovasc Thorac Res. 2015;7:32–37. doi: 10.15171/jcvtr.2014.07. [DOI] [PMC free article] [PubMed] [Google Scholar]
- 39.Peverill R.E., Harper R.W., Gan T.E., Smolich J.J. Effects of balloon mitral valvuloplasty on systemic and regional left atrial levels of prothrombin fragment 1+2 in mitral stenosis. Clin Sci (Lond) 2000;99:269–276. [PubMed] [Google Scholar]
Associated Data
This section collects any data citations, data availability statements, or supplementary materials included in this article.