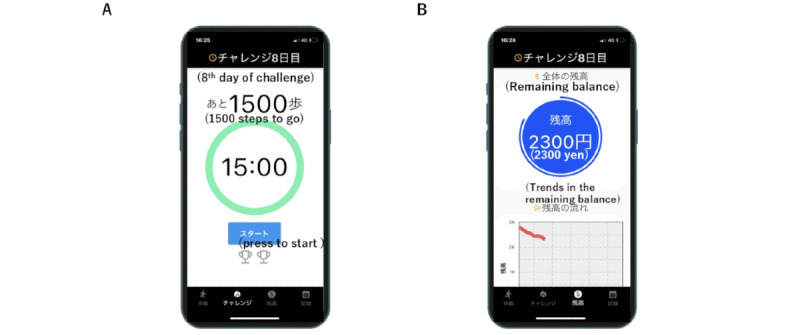
Figure 1.

The developed app’s interface is displayed. Panel (A) represents the daily challenge function. Panel (B) represents the function that enables users to track their current incentives earned during the study. The number in the green circle shows the time remaining for the challenge (15 minutes in this image). The start button, located at the lower part of the screen, can be pressed to begin. The number above the green circle indicates the remaining steps needed to accomplish the challenge. The number in the blue circle in panel (B) represents the maximum potential earnings during the remaining study period (JP¥ 2300 in this image; US $20.16). The chart in the lower half of the screen illustrates the trend of decreasing balances.
